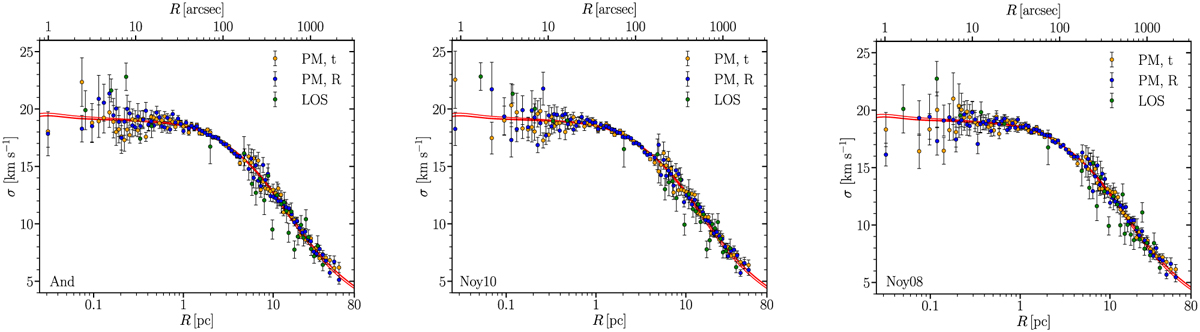
Fig. C.2
Download original image
Combined velocity dispersion profiles for the three components using the Anderson & Van der Marel (2010) center (And, left) Noyola et al. (2010) (Noy10, middle) and Noyola et al. (2008) (Noy08, right) kinematic centers. The maximum-posterior velocity dispersion profile (red) from our main analysis using the And center is shown for reference in all plots, yielding fits of comparable quality for all the cases considered. Due to the close-to-isotropic behavior of our inferred distribution at the 5.2 kpc distance employed, the three components of our maximum posterior fits are almost identical, with the large majority of the data points showing close overlap with each other.
Current usage metrics show cumulative count of Article Views (full-text article views including HTML views, PDF and ePub downloads, according to the available data) and Abstracts Views on Vision4Press platform.
Data correspond to usage on the plateform after 2015. The current usage metrics is available 48-96 hours after online publication and is updated daily on week days.
Initial download of the metrics may take a while.