Fig. 2
Download original image
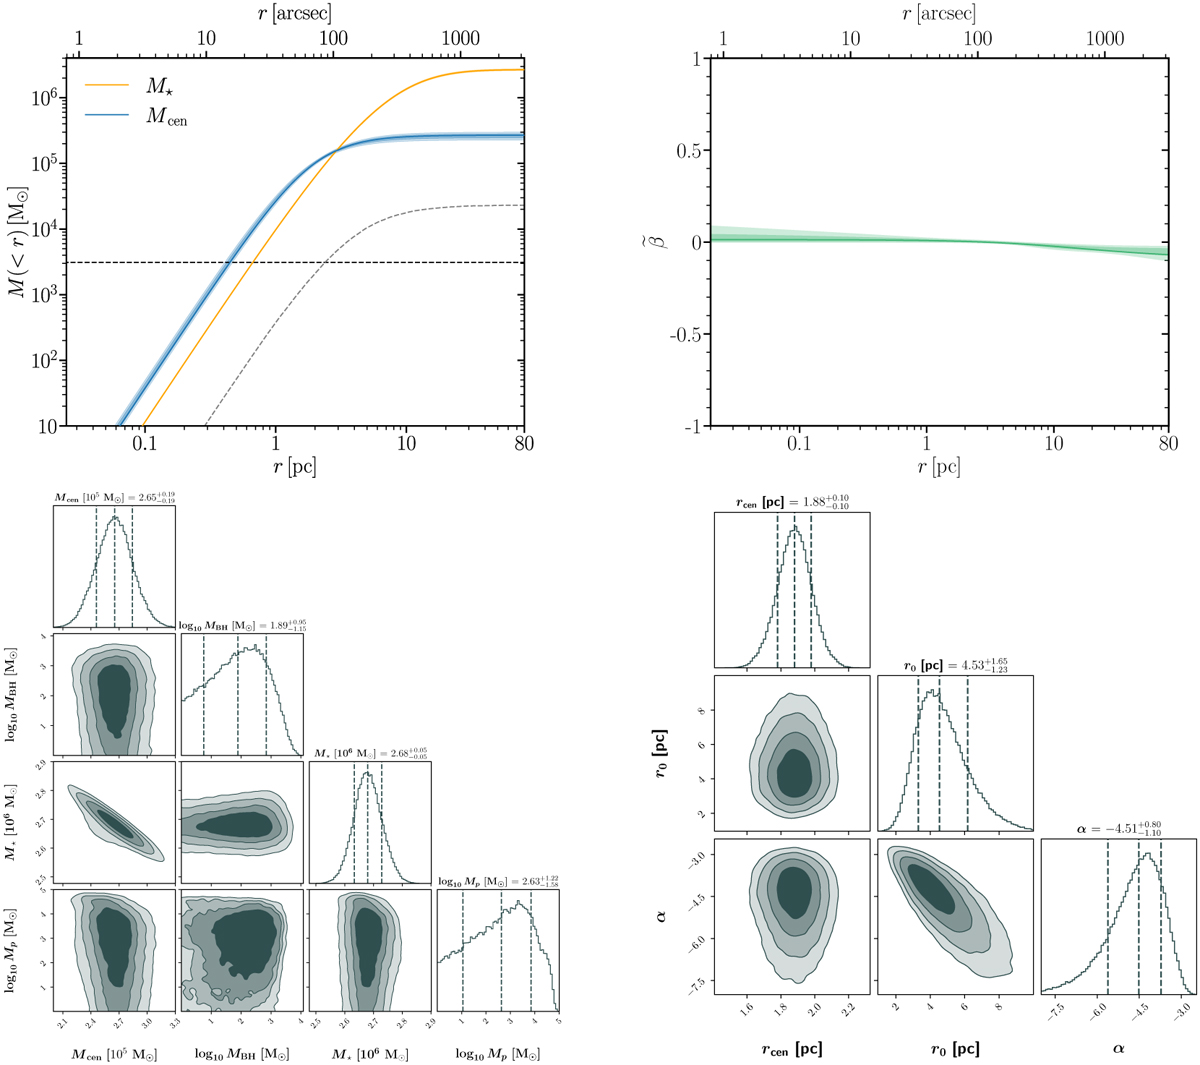
Results for the mass - anisotropy profiles and mass model / pulsar distribution parameters. Upper left: 3D enclosed mass profile including photometric, central remnants, black hole, and MSP mass components. The solid lines correspond to the maximum posterior with 68 and 95% CL regions. The black and gray dashed lines indicate the upper limit of the 95% CL region for the black hole and MSP components, respectively. Upper right: symmetrized anisotropy profile including the maximum posterior and 68 and 95% CL regions. The posterior distributions for the anisotropy parameters are presented in Appendix A. The profile is close to isotropic, with a mild radial (tangential) anisotropy in the inner (outer) regions. This translates to the 1σ CL band being well within ![]() , or |β| ≲ 0.15 for the vast majority of the range covered. Lower left: posterior distributions for the masses of the various fitted components of our analysis, indicating the median and 68% CL region at the top of each distribution. Lower right: posterior distributions for the morphological parameters of the fitted mass profiles with respective median and 68% CL regions.
, or |β| ≲ 0.15 for the vast majority of the range covered. Lower left: posterior distributions for the masses of the various fitted components of our analysis, indicating the median and 68% CL region at the top of each distribution. Lower right: posterior distributions for the morphological parameters of the fitted mass profiles with respective median and 68% CL regions.
Current usage metrics show cumulative count of Article Views (full-text article views including HTML views, PDF and ePub downloads, according to the available data) and Abstracts Views on Vision4Press platform.
Data correspond to usage on the plateform after 2015. The current usage metrics is available 48-96 hours after online publication and is updated daily on week days.
Initial download of the metrics may take a while.