Fig. 5
Download original image
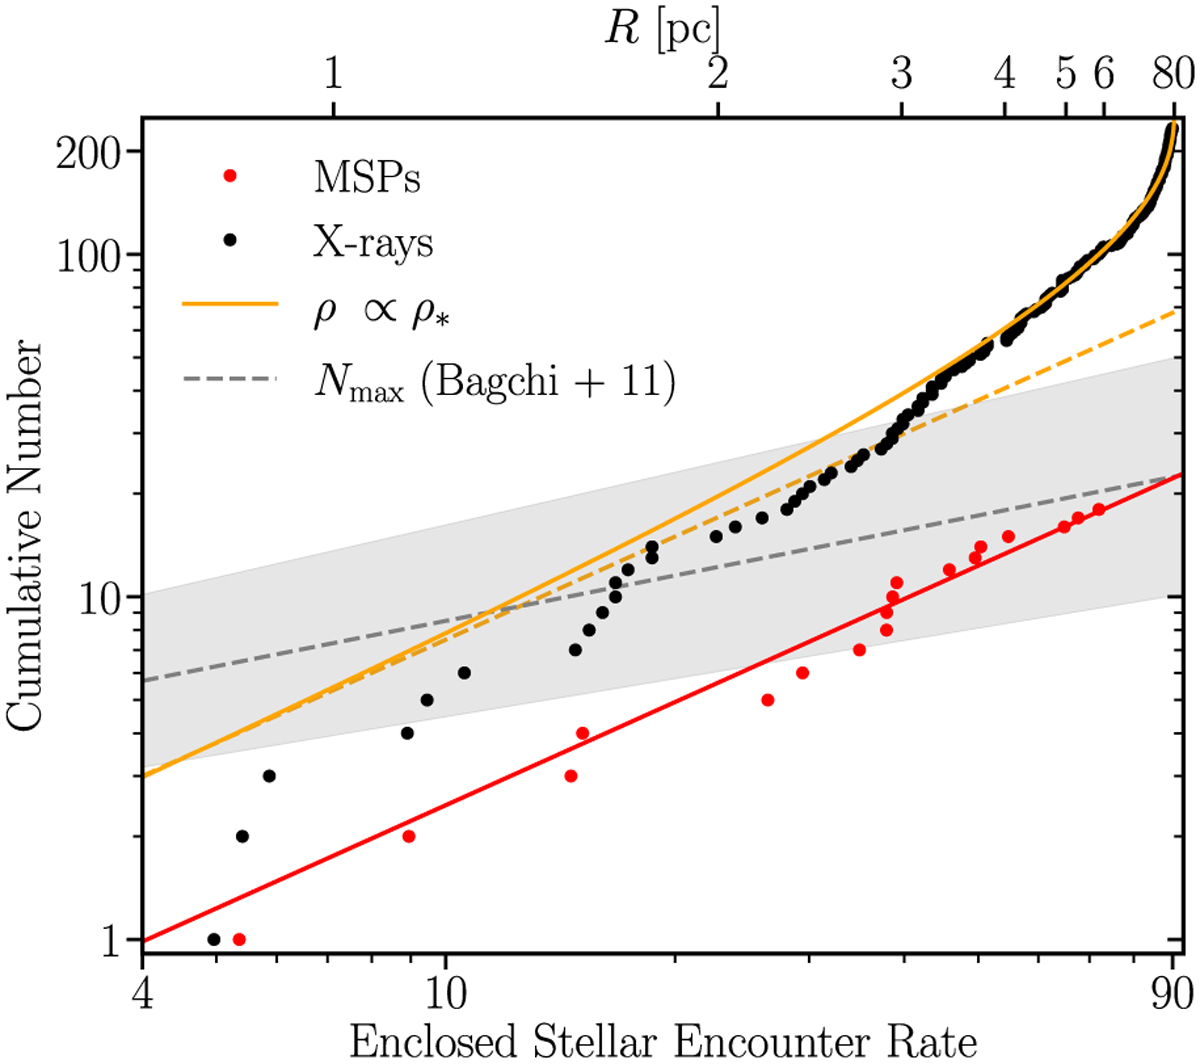
MSP abundances as a function of stellar encounter rates. The red points are the observed cumulative number of MSPs as a function of the enclosed encounter rate at a projected radius R (upper x-axis). The red line corresponds to a least-squares linear fit, showing a clear linear dependence. The black points denote the same quantities for the full list of 233 X-ray sources from Henleywillis et al. (2018), while the orange line corresponds to the stellar distribution, normalized to match these sources. These show a distinct, nonlinear, dependence, with encounter rates that are not followed by the MSPs. The orange, dashed line is a linear extrapolation shown for comparison. Lastly, the gray dashed line indicates an upper estimate on the total number of MSPs as a function of total encounter rates of GCs, with 1σ error bands. This is based on the parametric fit performed by Zhao & Heinke (2022) using the phenomenological estimates of Bagchi et al. (2011), based on luminosity functions, and assuming the updated total stellar encounter rates of Bahramian et al. (2013). Units for ω Cen’s total encounter have been normalized to match the 90.4 central value of Bahramian et al. (2013).
Current usage metrics show cumulative count of Article Views (full-text article views including HTML views, PDF and ePub downloads, according to the available data) and Abstracts Views on Vision4Press platform.
Data correspond to usage on the plateform after 2015. The current usage metrics is available 48-96 hours after online publication and is updated daily on week days.
Initial download of the metrics may take a while.