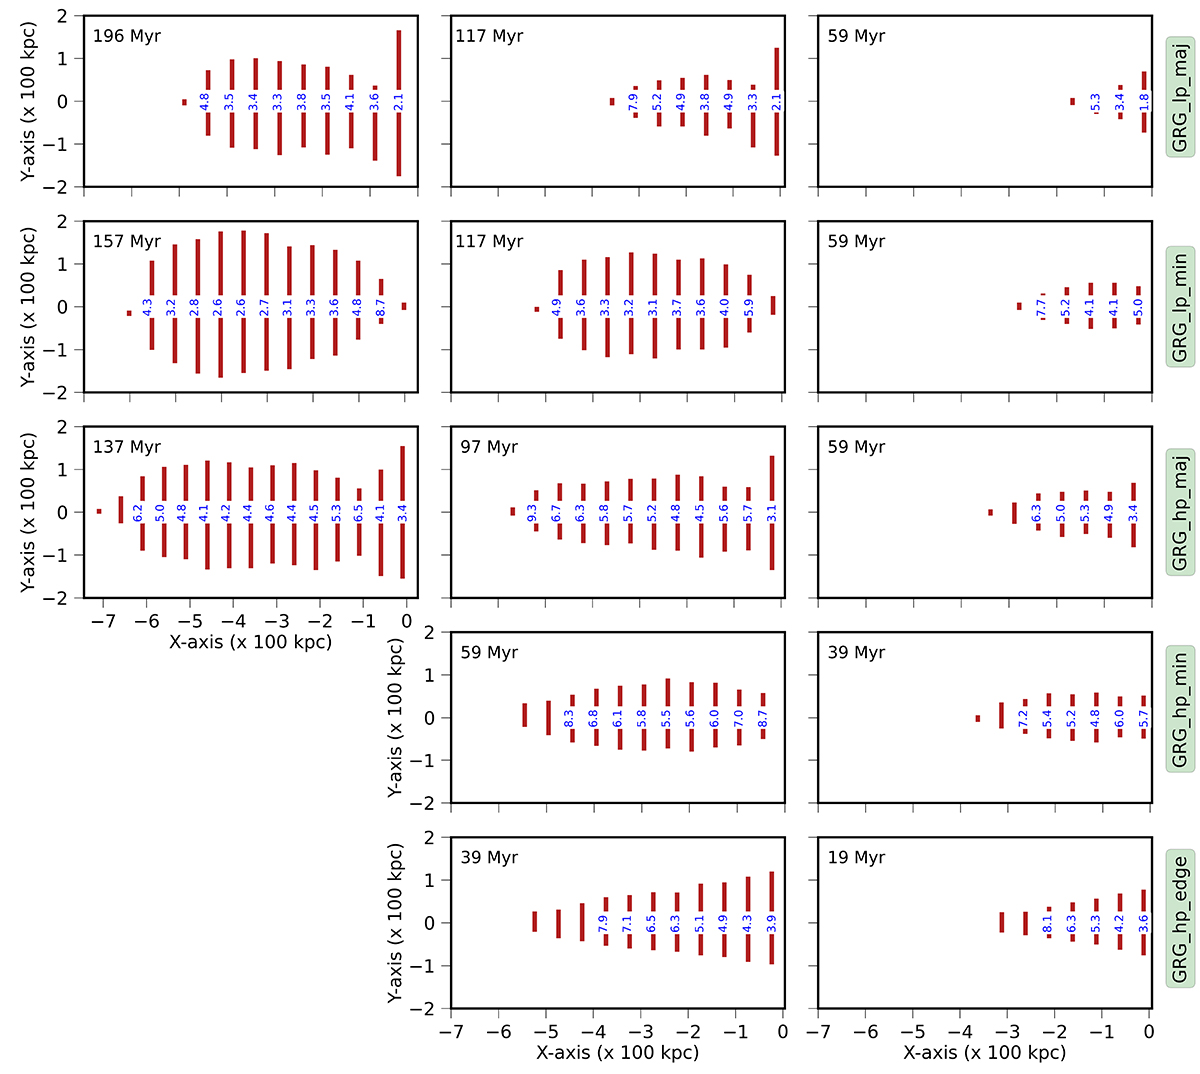
Fig. 7.
Download original image
Demonstration of temporal evolution of the structural topology originated from five simulations conducted in this work. Each row presents a simulation case, with labels attached to the rightmost part of that row. The evolution of the sources starts from the right column and progresses leftward, with the corresponding ages mentioned in the top corner of each box. The red-lines represent lateral extent of the radio lobe, that is, the width of the lobe, and the numbers attached to the lines denote the axial ratios (ratio of total length to width at that time) spread across the cocoon.
Current usage metrics show cumulative count of Article Views (full-text article views including HTML views, PDF and ePub downloads, according to the available data) and Abstracts Views on Vision4Press platform.
Data correspond to usage on the plateform after 2015. The current usage metrics is available 48-96 hours after online publication and is updated daily on week days.
Initial download of the metrics may take a while.