Fig. 4
Download original image
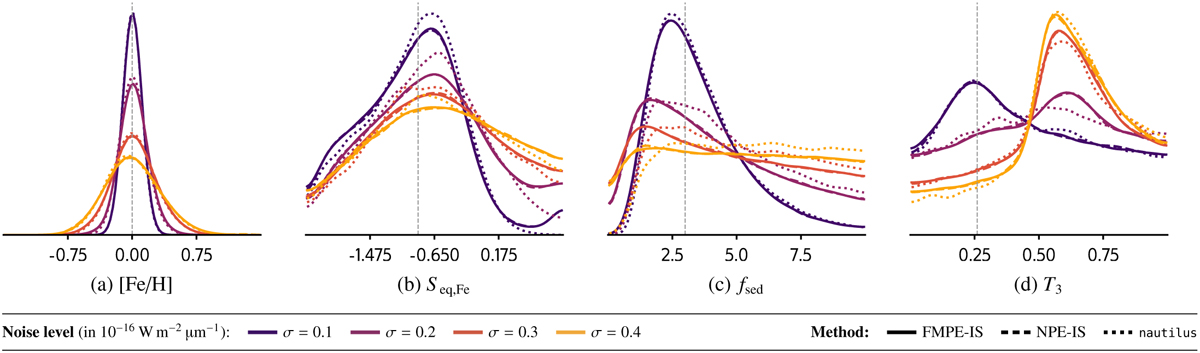
Marginal posterior distributions for the noise-free benchmark spectrum for four atmospheric parameters at different assumed noise levels, σ (encoded by color), and for three different inference methods (encoded by line style). In each plot, the x axis spans the prior range, the dashed gray line marks the respective ground truth value, and the y axis shows the density at an arbitrary scale.
Current usage metrics show cumulative count of Article Views (full-text article views including HTML views, PDF and ePub downloads, according to the available data) and Abstracts Views on Vision4Press platform.
Data correspond to usage on the plateform after 2015. The current usage metrics is available 48-96 hours after online publication and is updated daily on week days.
Initial download of the metrics may take a while.