Fig. 5
Download original image
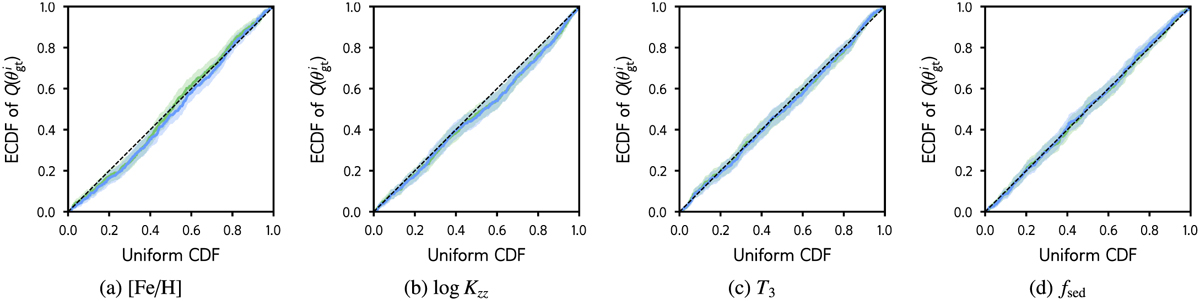
P–P plot showing the ECDFs of Q(![]() ) against a uniform CDF for different atmospheric parameters and for both FMPE and NPE. The shaded regions indicate the respective 95% confidence interval computed by scipy.stats.ecdf(). Panels a and b show the results for the atmospheric parameters with the largest visual deviation from the diagonal (“worst case”), while panels c and d show the “best case.” All results are from the default test set.
) against a uniform CDF for different atmospheric parameters and for both FMPE and NPE. The shaded regions indicate the respective 95% confidence interval computed by scipy.stats.ecdf(). Panels a and b show the results for the atmospheric parameters with the largest visual deviation from the diagonal (“worst case”), while panels c and d show the “best case.” All results are from the default test set.
Current usage metrics show cumulative count of Article Views (full-text article views including HTML views, PDF and ePub downloads, according to the available data) and Abstracts Views on Vision4Press platform.
Data correspond to usage on the plateform after 2015. The current usage metrics is available 48-96 hours after online publication and is updated daily on week days.
Initial download of the metrics may take a while.