Fig. 7
Download original image
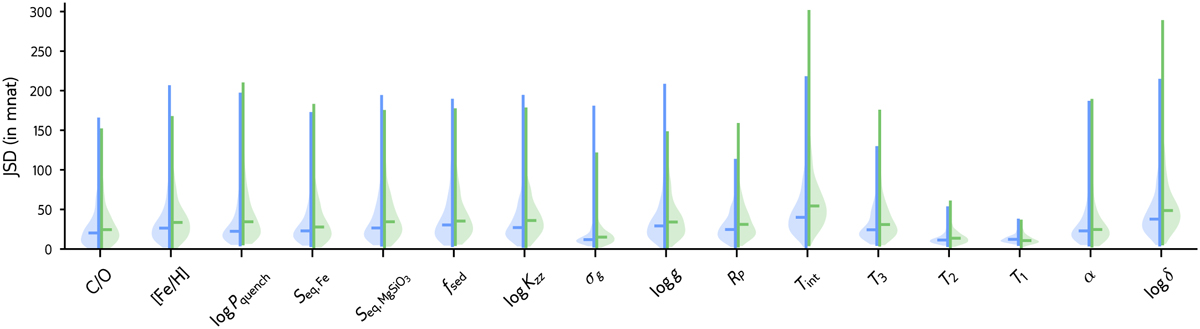
Distribution of the JSD between the posterior marginals with and without IS on the Gaussian test set for FMPE and NPE. Lower is better. The vertical line indicates the support of the distribution, while the horizontal bar marks the median. We have only included retrievals with a sampling efficiency of ε > 1% to that ensure the IS-based posterior is reliable.
Current usage metrics show cumulative count of Article Views (full-text article views including HTML views, PDF and ePub downloads, according to the available data) and Abstracts Views on Vision4Press platform.
Data correspond to usage on the plateform after 2015. The current usage metrics is available 48-96 hours after online publication and is updated daily on week days.
Initial download of the metrics may take a while.