Fig. 2

Download original image
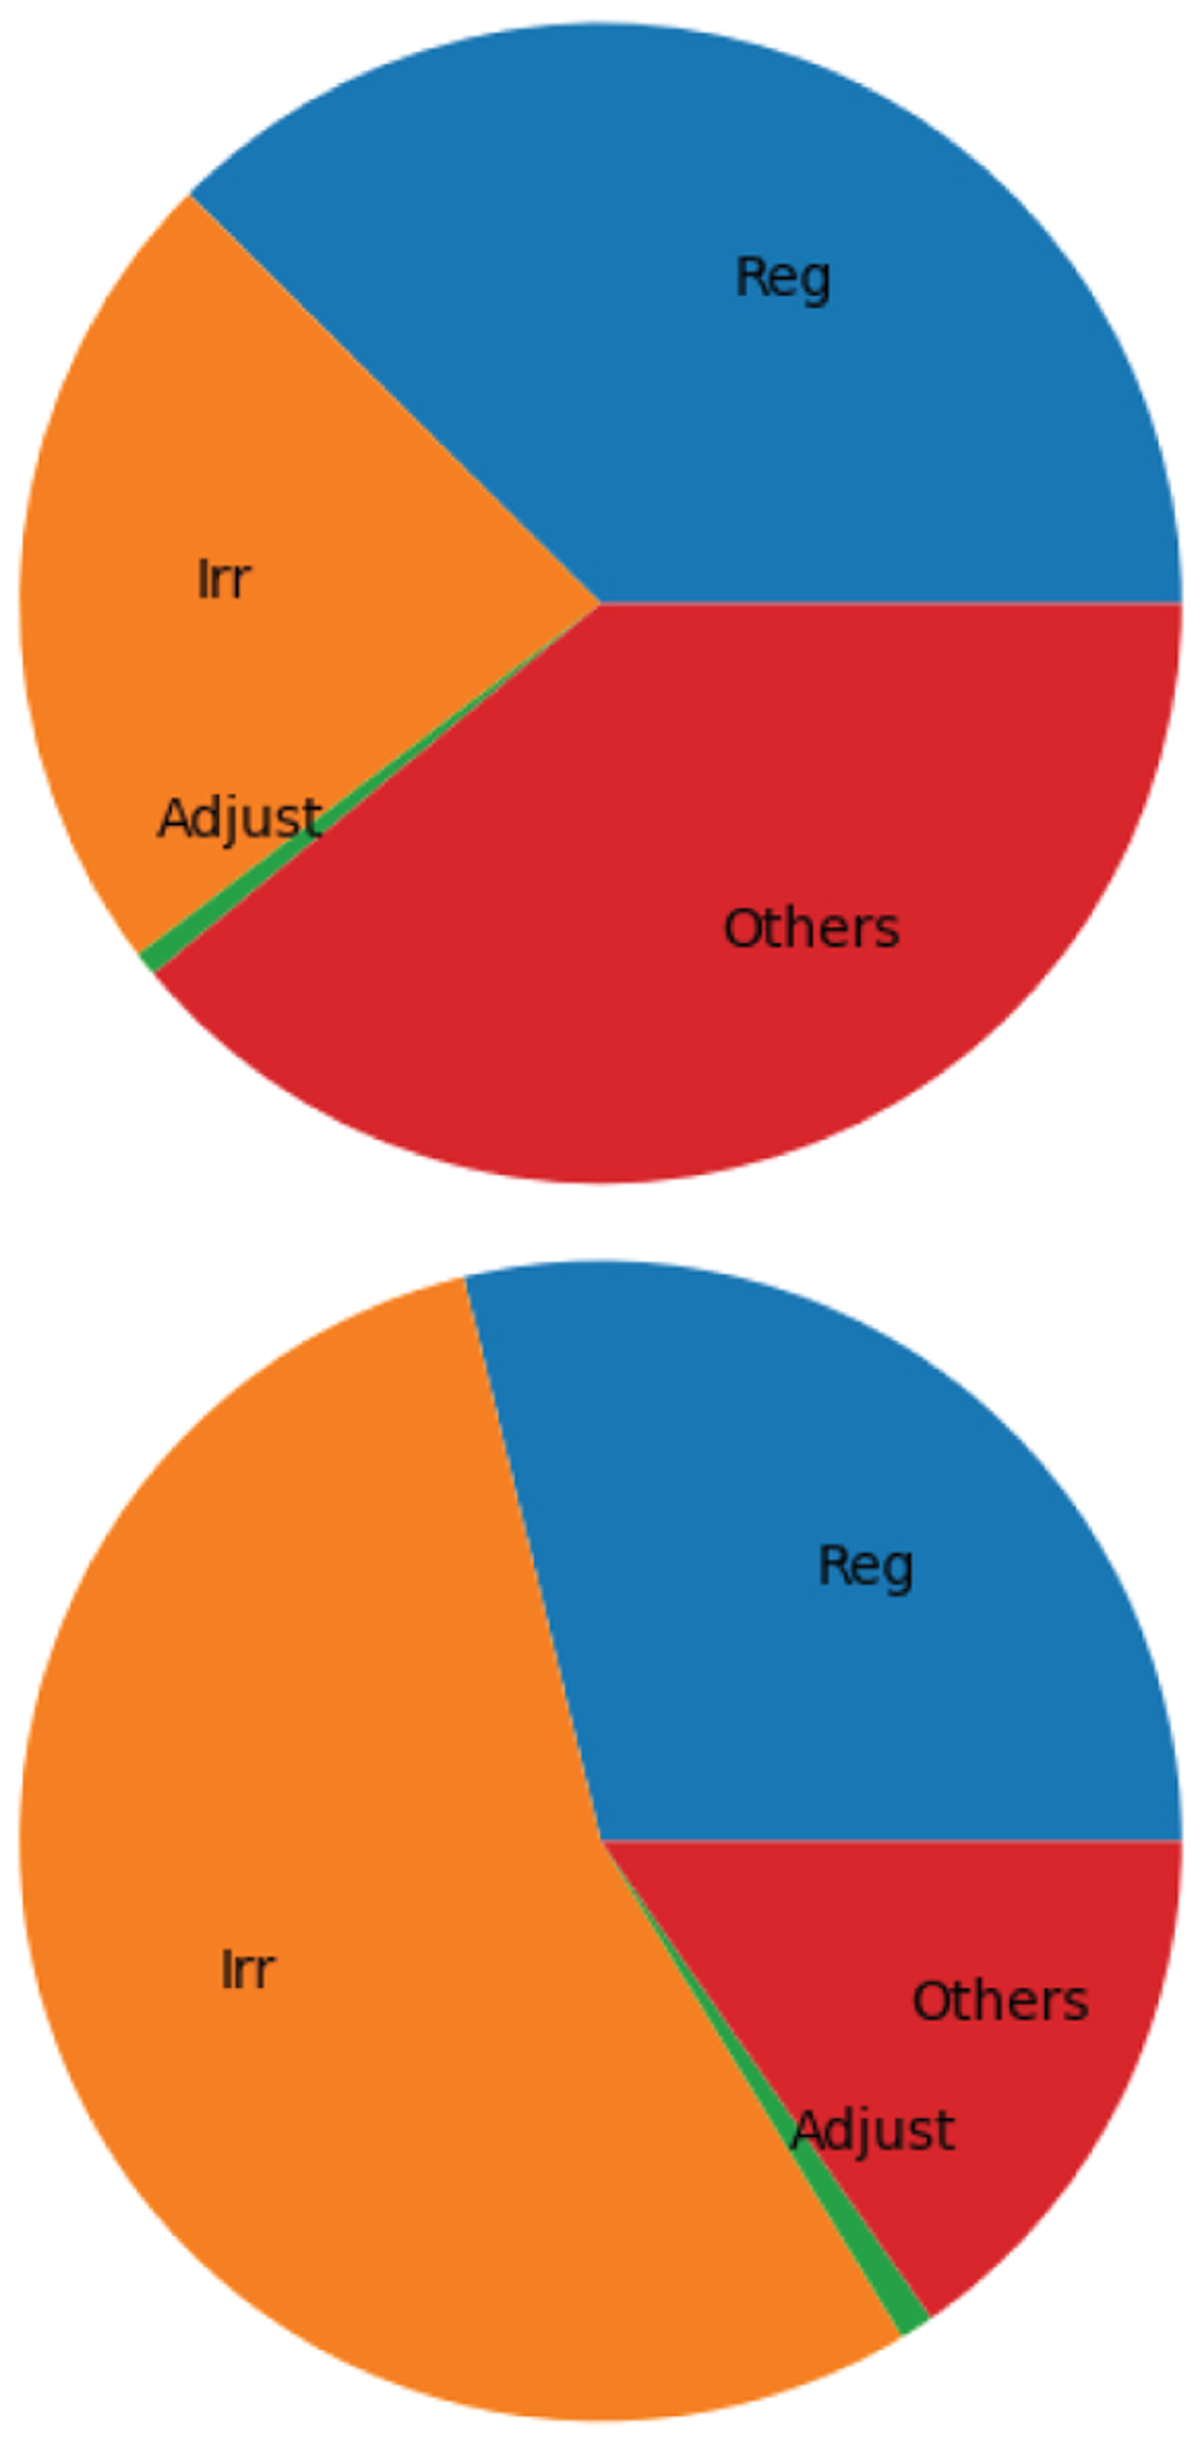
Wall-clock calculation times for different processes in the simulation with Ns = 64 000 and Np = 64 000 (top pie chart) and Ns = 128 000 and Np = 0 (bottom pie chart) in Fig. 1. The chart presents the wall-clock time for time intervals of the total simulation time (ten code units). Different numerical processes are indicated by colour: regular force calculations (blue), irregular force calculations (orange), adjustment processes (green), and others (red). It is immediately noticeable that the irregular force calculations consistently take less time overall in the simulation with massless particles.
Current usage metrics show cumulative count of Article Views (full-text article views including HTML views, PDF and ePub downloads, according to the available data) and Abstracts Views on Vision4Press platform.
Data correspond to usage on the plateform after 2015. The current usage metrics is available 48-96 hours after online publication and is updated daily on week days.
Initial download of the metrics may take a while.


