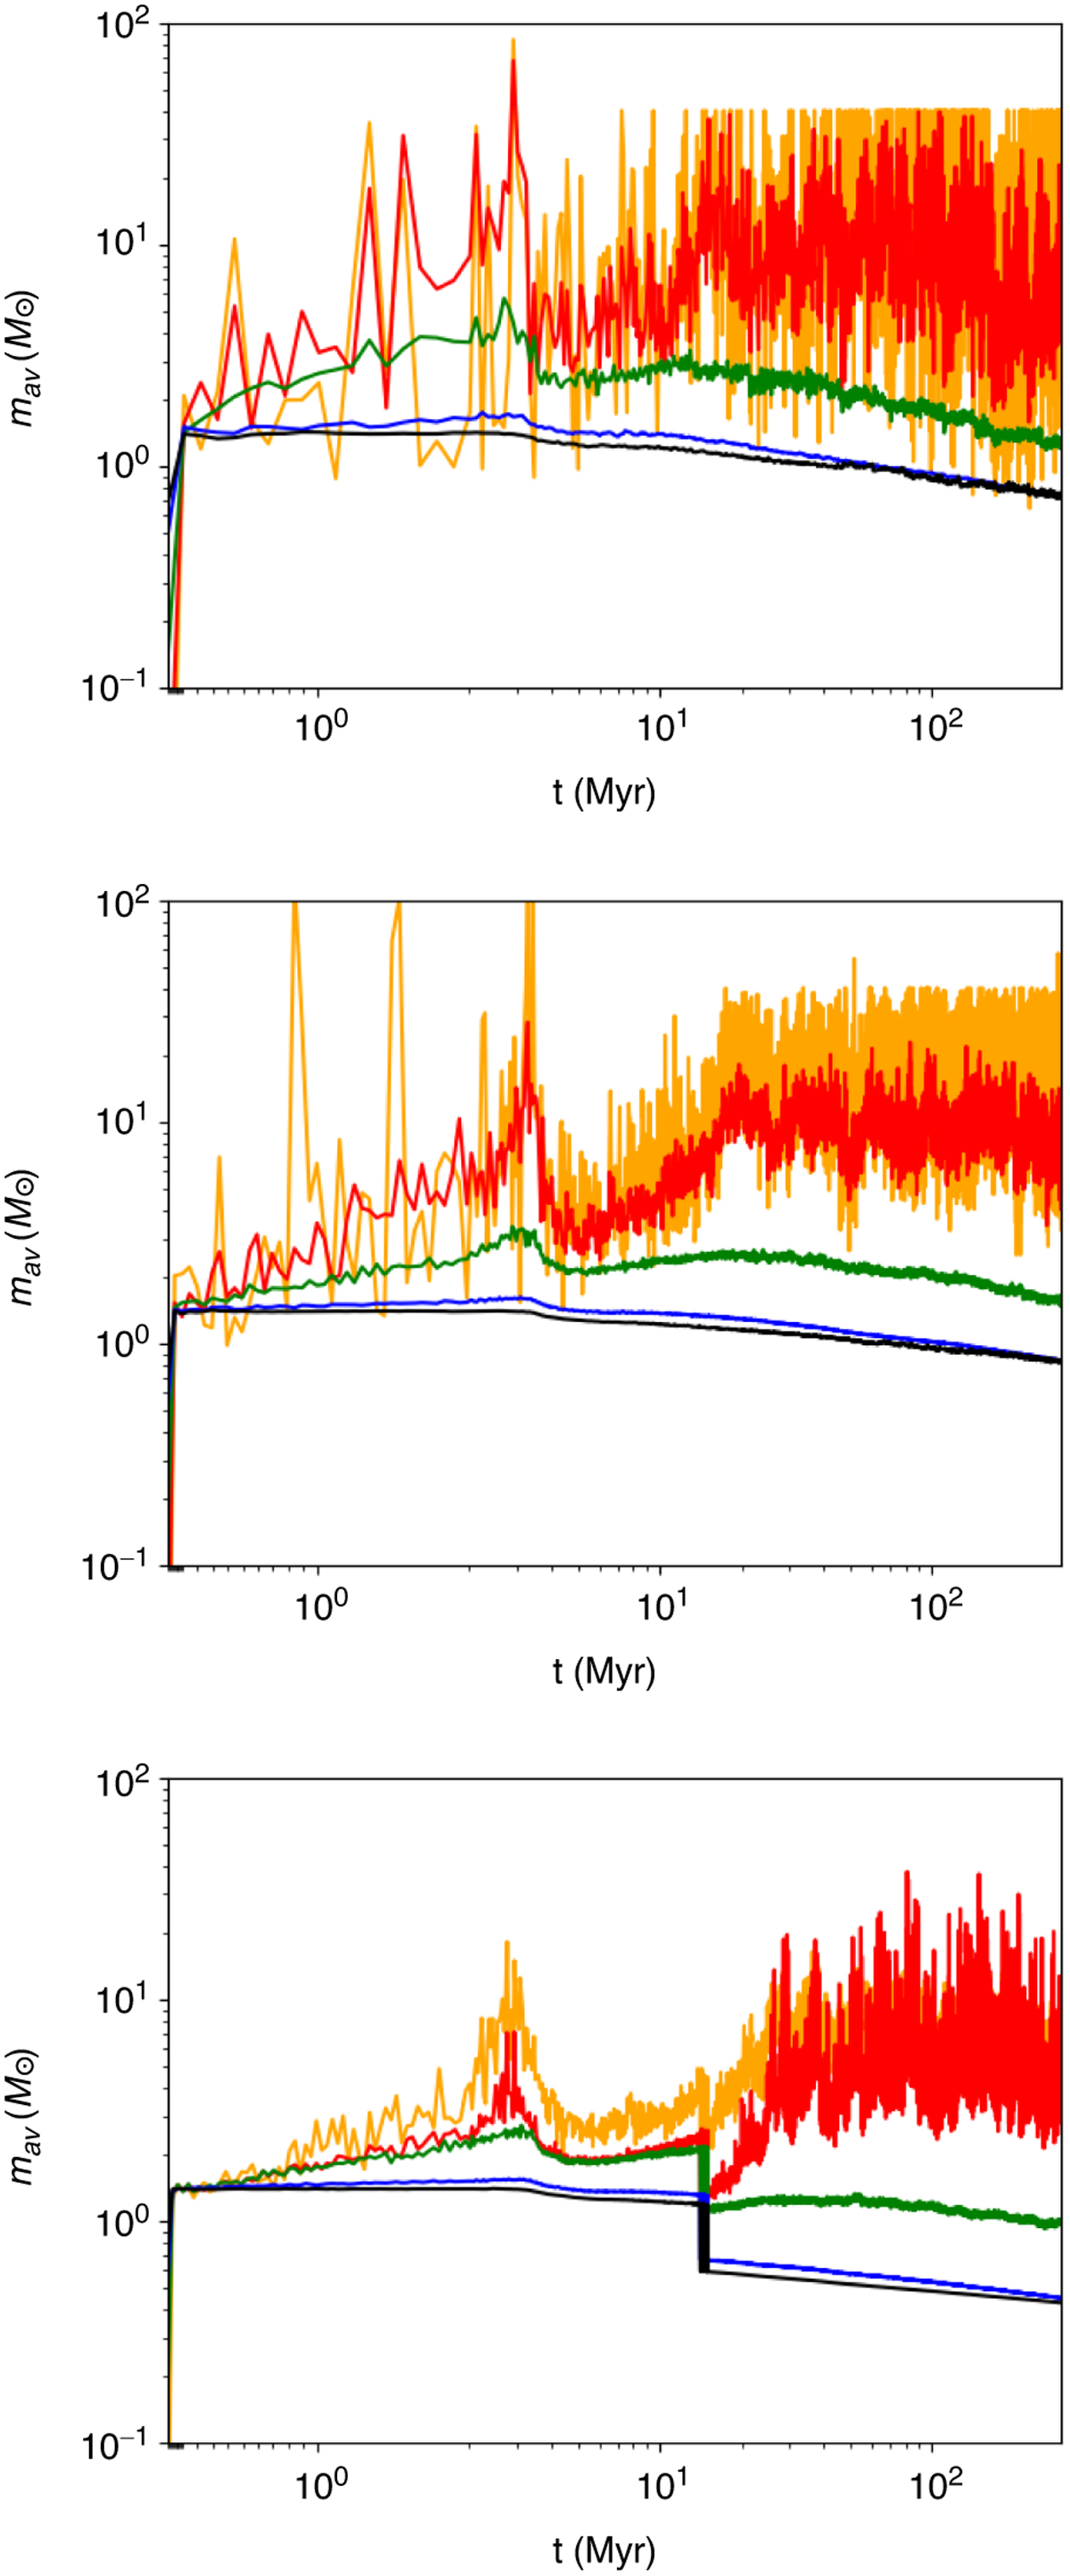
Fig. 5
Download original image
Evolution of the average stellar mass within the 0.1 (orange curve), 1 (red curve), 10 (green curve), 50 (blue curve), and 90% (black curve) Lagrangian shells for models C12.8k (top), C64.8k (middle), and C128k (bottom). The evolution in the first million years is dominated by stellar evolution and mass segregation, and it is steadier in all shells around 20 Myrs. The average mass of the inner Lagrangian shells changes more frequently due to the lower number of stars in the shells. This is more evident in the low density model.
Current usage metrics show cumulative count of Article Views (full-text article views including HTML views, PDF and ePub downloads, according to the available data) and Abstracts Views on Vision4Press platform.
Data correspond to usage on the plateform after 2015. The current usage metrics is available 48-96 hours after online publication and is updated daily on week days.
Initial download of the metrics may take a while.