Open Access
Fig. 6
Download original image
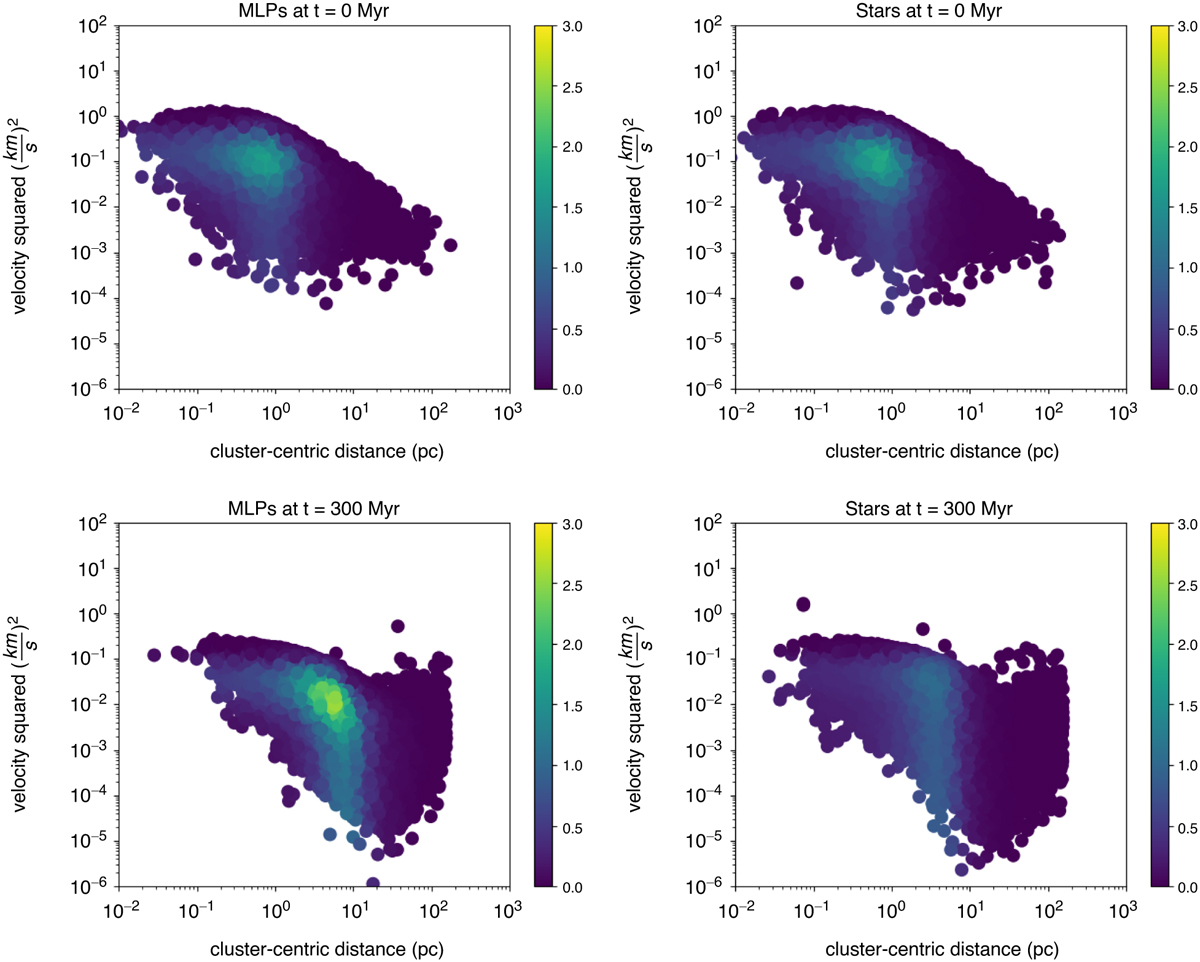
Distances and speeds of MLPs (left column) and stars (right column) at t = 0 Myr (top) and at t = 300 Myr (bottom) for model C128k. Colours indicate the number density of the data in the plot, as shown in the colourbar. For the methodology used, we refer to Flammini Dotti et al. (2023).
Current usage metrics show cumulative count of Article Views (full-text article views including HTML views, PDF and ePub downloads, according to the available data) and Abstracts Views on Vision4Press platform.
Data correspond to usage on the plateform after 2015. The current usage metrics is available 48-96 hours after online publication and is updated daily on week days.
Initial download of the metrics may take a while.