Fig. 1
Download original image
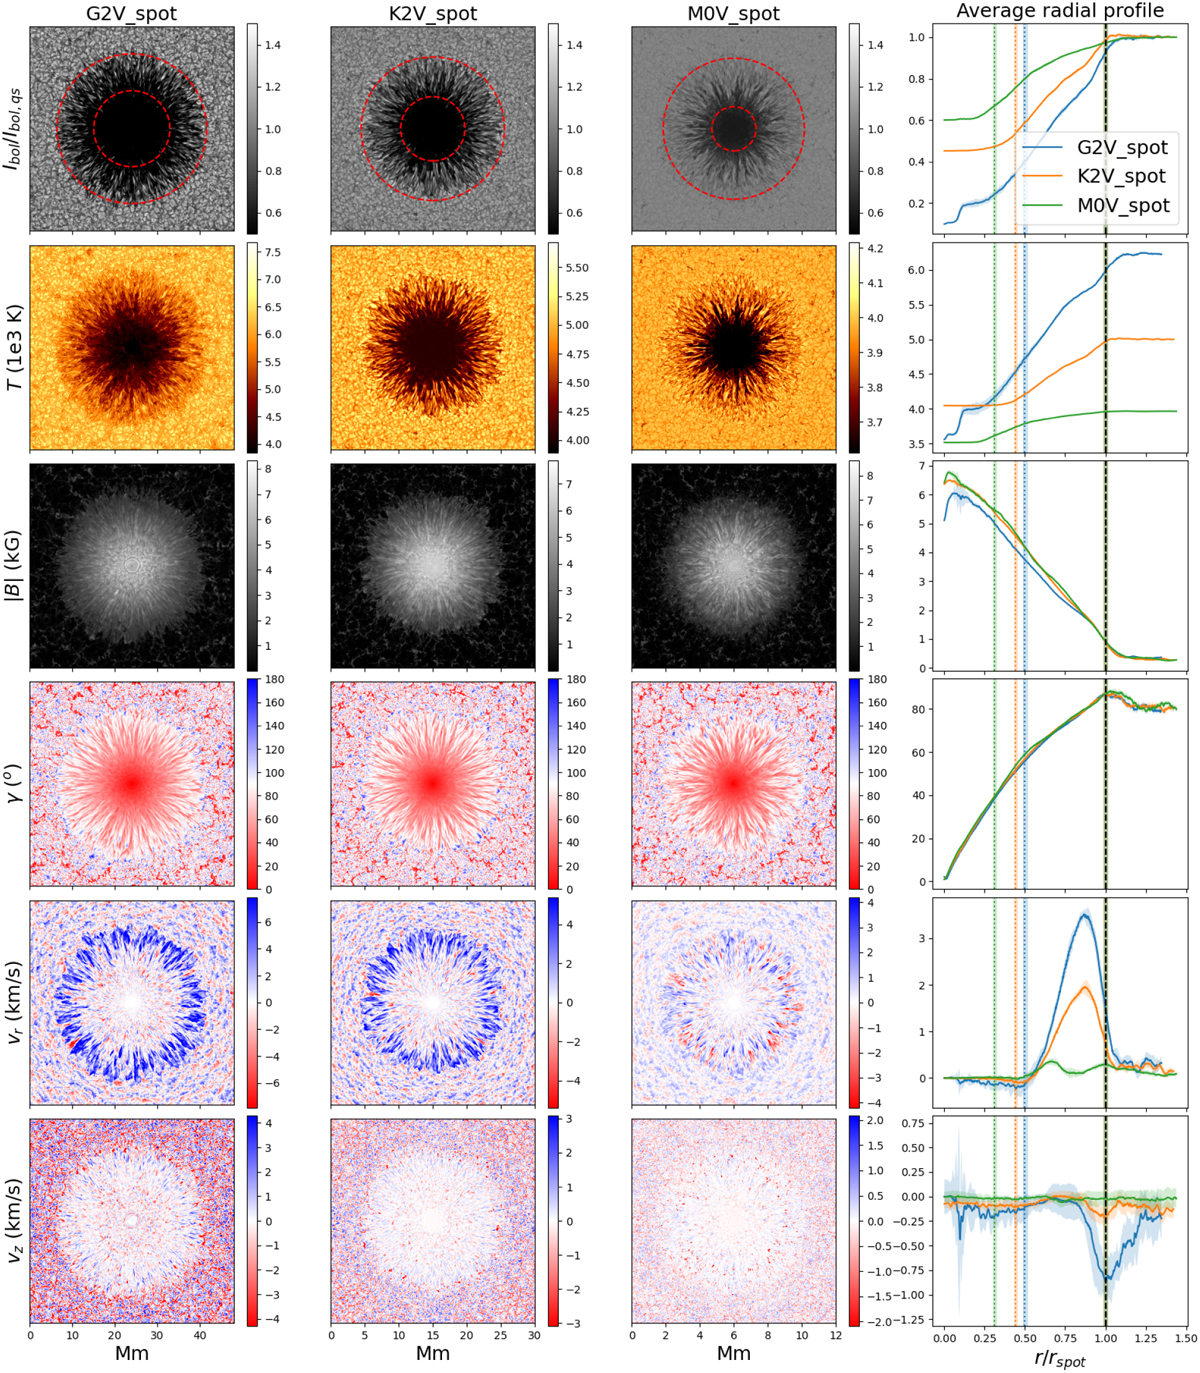
Snapshots of surface (τ = 1) structure of bolometric intensity (first row), temperature (second row), magnetic field magnitude (third row), field inclination (fourth row), radial velocity (fifth row) and vertical velocity (sixth row) for the G2V (first column), K2V (second column), and M0V (third column) starspot. The rightmost (fourth) column shows the azimuthal average of the corresponding quantities in each row for all three stars, plotted against radius normalized by average spot radius. The dashed lines show the average extent of the penumbra and dotted lines show the average extent of the umbra. These extents are shown in the first row as red circles. The error bars show 1σ standard deviation averaged over time. For vz, positive values correspond to upwards and outwards flow.
Current usage metrics show cumulative count of Article Views (full-text article views including HTML views, PDF and ePub downloads, according to the available data) and Abstracts Views on Vision4Press platform.
Data correspond to usage on the plateform after 2015. The current usage metrics is available 48-96 hours after online publication and is updated daily on week days.
Initial download of the metrics may take a while.