Fig. 2
Download original image
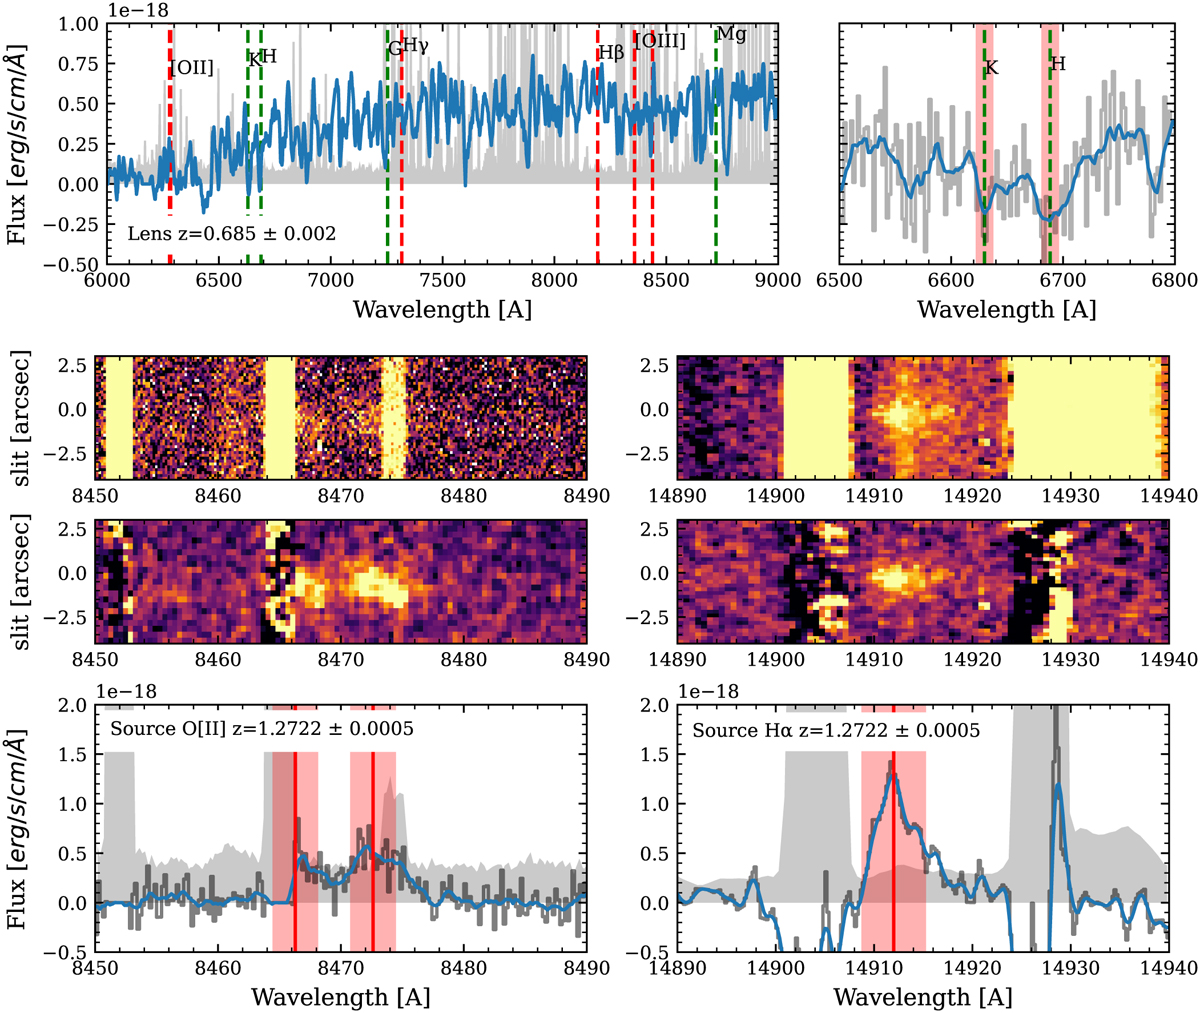
X-shooter spectra of the BGG and the source S1a.1. Top panels: X-shooter 1D spectrum of the BGG at redshift z = 0.685 ± 0.002. The redshift is driven by the K and H absorption lines (right panel), as well as the shape of the continuum. The red-shaded region around the K and H lines represents the associated uncertainty. Second-row panels: 2D spectrum of the source S1a.1 at redshift z = 1.2722 ± 0.0005 without sky subtraction, centered around the [O II] (left) and Hα (right). Third row panels: 2D spectrum with sky subtraction applied. The [O II] spectrum has been rebinned by a factor of 2 × 2 to enhance the signal-to-noise ratio. Bottom panels: 1D sky-subtracted spectra of both [O II] and Hα emission lines at redshift z = 1.2722 ± 0.0005, the red line shows the expected position of the line and the red shaded region shows the uncertainty. The red vertical line marks the expected position of each line, and the red shaded region represents the associated uncertainty. In all 1D spectra, the gray histogram displays the unbinned spectrum, the blue curve shows the same spectrum with a binning of 3 pixels and the gray shaded region represents the rescaled sky level for visualization purposes.
Current usage metrics show cumulative count of Article Views (full-text article views including HTML views, PDF and ePub downloads, according to the available data) and Abstracts Views on Vision4Press platform.
Data correspond to usage on the plateform after 2015. The current usage metrics is available 48-96 hours after online publication and is updated daily on week days.
Initial download of the metrics may take a while.