Fig. 3
Download original image
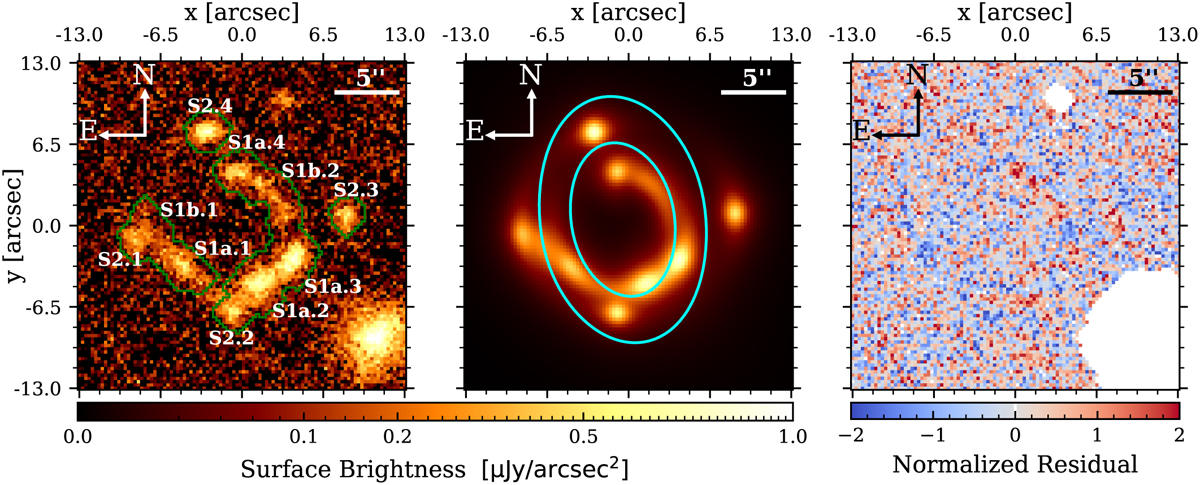
Model reproduction of the observed g-band surface brightness. Left panel: g-band image with g1–g5 foreground-light subtracted. The green regions show the pixels included in the simulation. Image systems are labeled as S1a.1-4, S1b.1-2, and S2.1-4. Middle panel: model reproduction of the image based on the median of the marginalized parameters. The tangential critical lines are shown in cyan for the source plane S1 (inner) and S2 (outer). Right panel: normalized residual between the model and the g-band image. The remaining foreground galaxies are masked; the residual is below 2σ for most of the model.
Current usage metrics show cumulative count of Article Views (full-text article views including HTML views, PDF and ePub downloads, according to the available data) and Abstracts Views on Vision4Press platform.
Data correspond to usage on the plateform after 2015. The current usage metrics is available 48-96 hours after online publication and is updated daily on week days.
Initial download of the metrics may take a while.