Fig. 4
Download original image
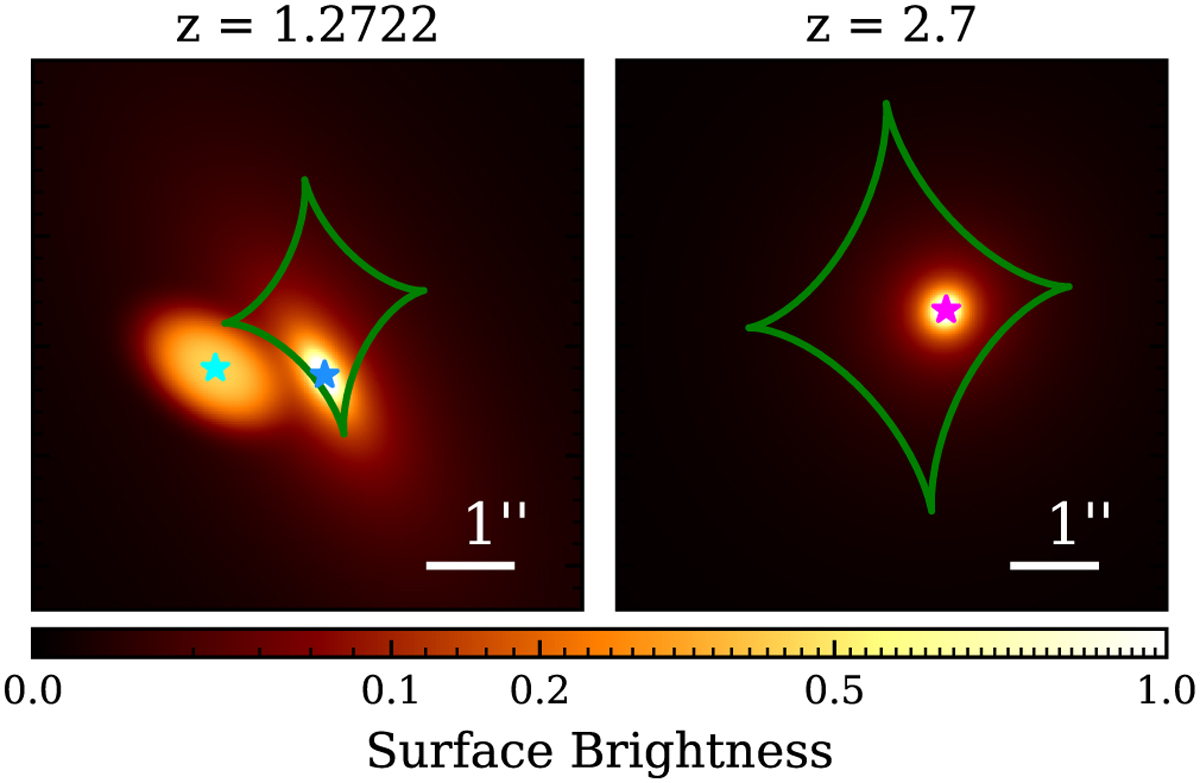
Surface brightness model for the sources S1a and S1b (left) and S2 (right) in micro-Jansky per arcsecond squared. The green lines show the caustic. The blue, cyan, and magenta stars indicate the point source at the center of S1a, S1b, and S2 respectively. Source S2 is predicted to be at z = 2.7 by the single-lens plane model.
Current usage metrics show cumulative count of Article Views (full-text article views including HTML views, PDF and ePub downloads, according to the available data) and Abstracts Views on Vision4Press platform.
Data correspond to usage on the plateform after 2015. The current usage metrics is available 48-96 hours after online publication and is updated daily on week days.
Initial download of the metrics may take a while.