Fig. 5
Download original image
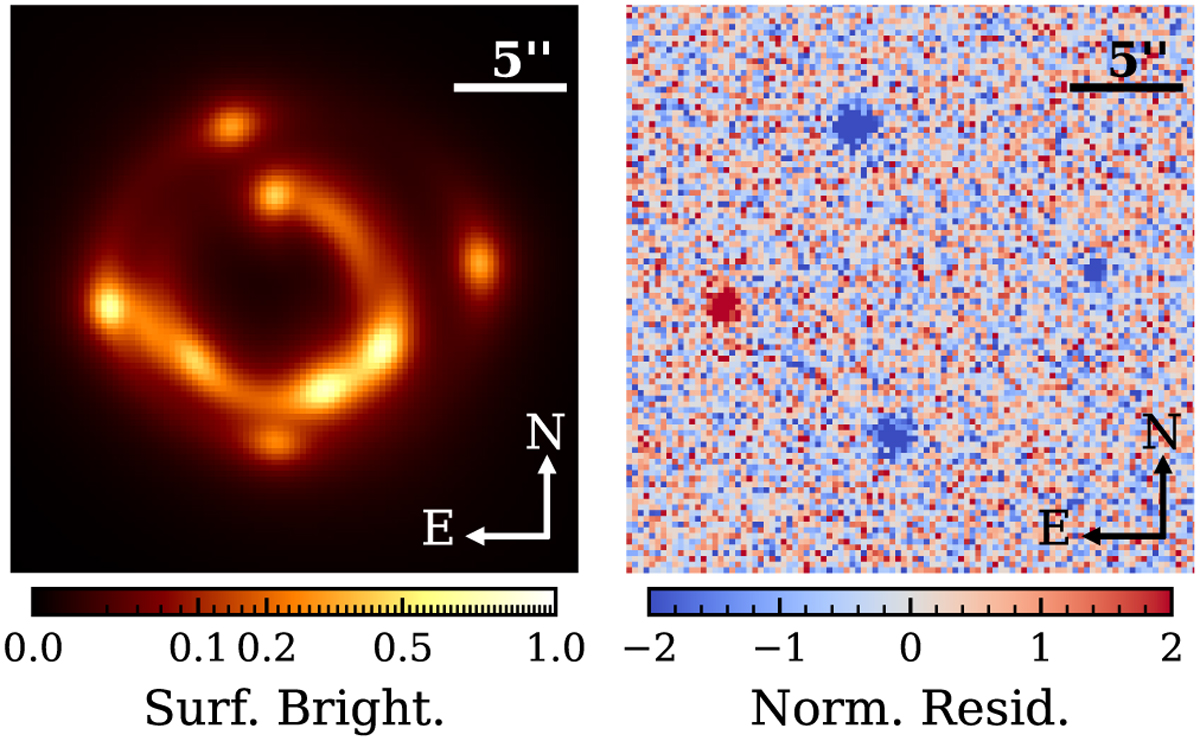
Simulated impact of the mass of S1 on S2 images. Left: model consisting of two lens planes. The plane at zL has the same mass model as the one shown in Fig. 3, while the plane at zS 1 is characterized by a SIE model with a velocity dispersion of σv,S 1 = 100 km/s and the same geometry as the surface brightness profile of S1a. Right: normalized residual between the dual and single plane models, along with the noise. The S2 images exhibit a noticeable difference between the two models, indicating that the mass of S1a has a significant impact.
Current usage metrics show cumulative count of Article Views (full-text article views including HTML views, PDF and ePub downloads, according to the available data) and Abstracts Views on Vision4Press platform.
Data correspond to usage on the plateform after 2015. The current usage metrics is available 48-96 hours after online publication and is updated daily on week days.
Initial download of the metrics may take a while.