Open Access
Fig. 1.
Download original image
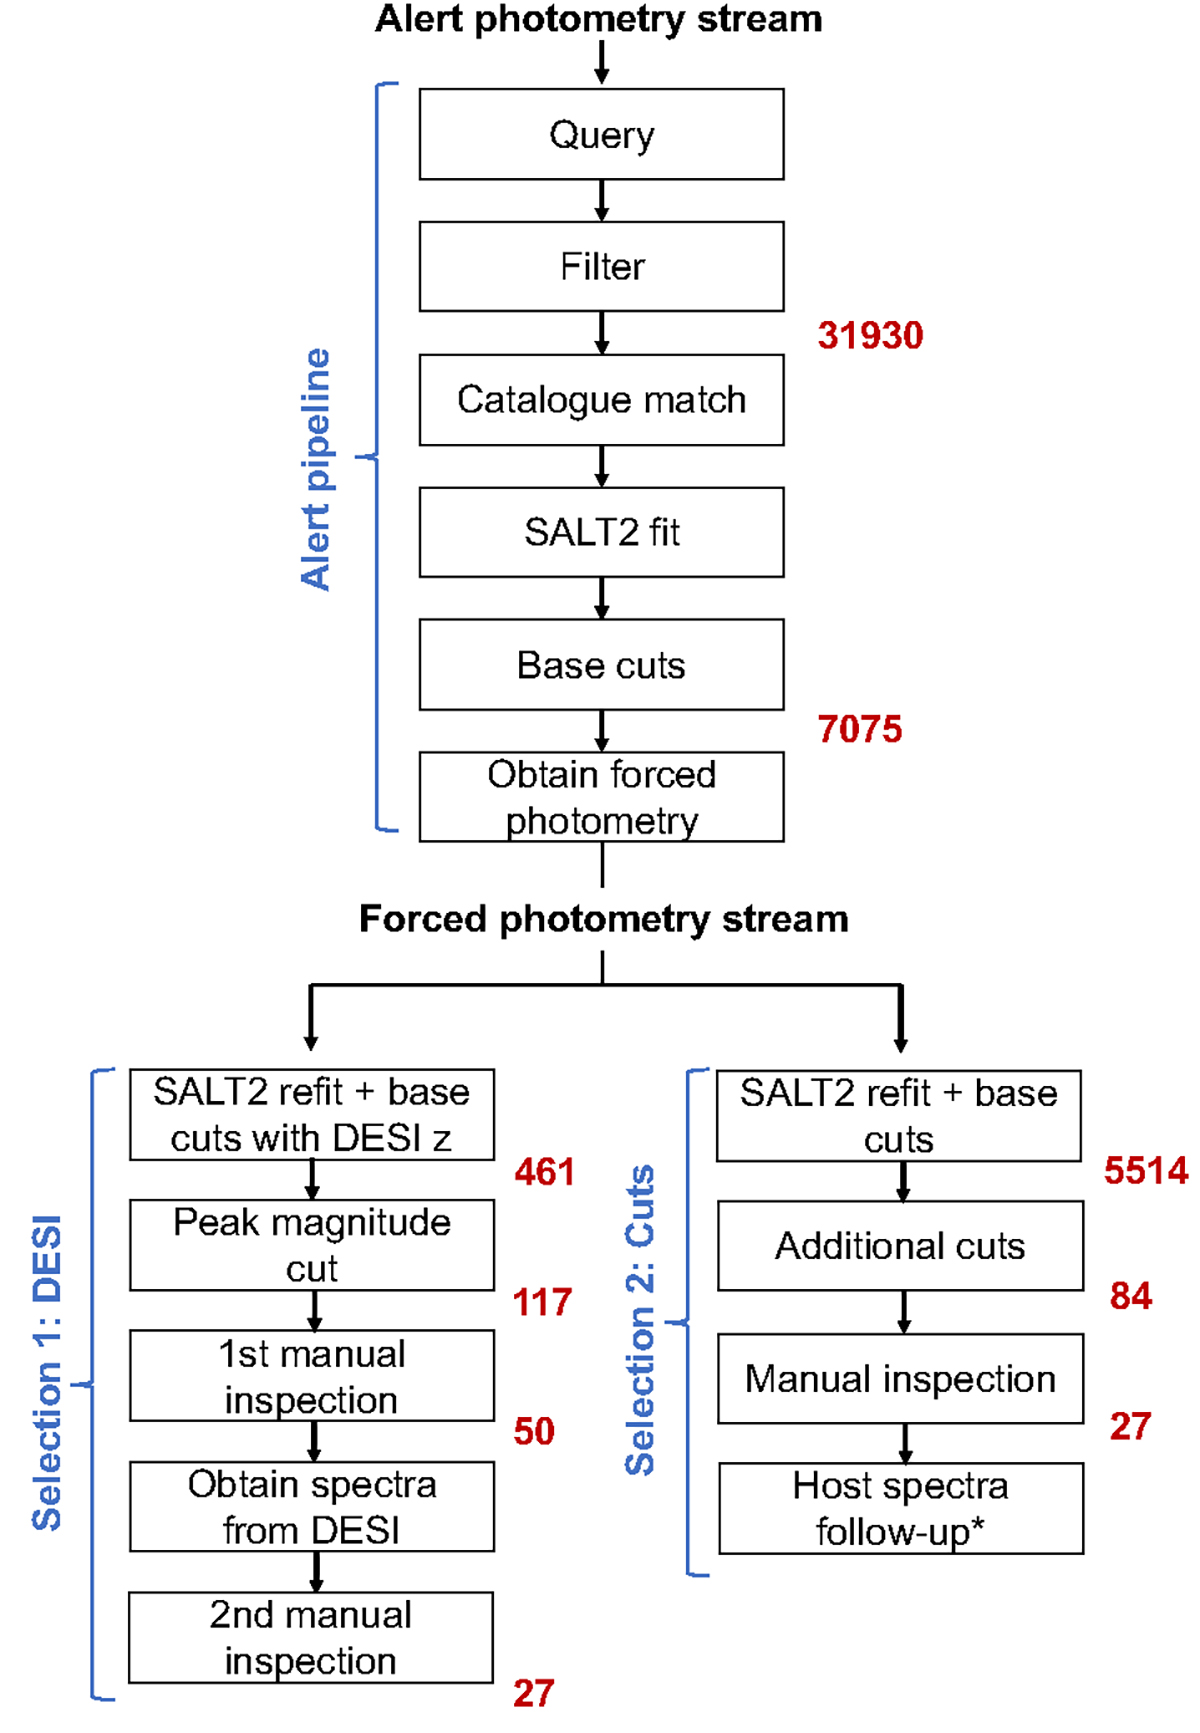
Flowchart to illustrate the stages of the method, as is described in Sect. 4. The red numbers to the bottom right of the boxes indicate the number of transients that remained after that stage of the analysis. The asterisk represents a stage that has not been completed during our study and is left for future work.
Current usage metrics show cumulative count of Article Views (full-text article views including HTML views, PDF and ePub downloads, according to the available data) and Abstracts Views on Vision4Press platform.
Data correspond to usage on the plateform after 2015. The current usage metrics is available 48-96 hours after online publication and is updated daily on week days.
Initial download of the metrics may take a while.