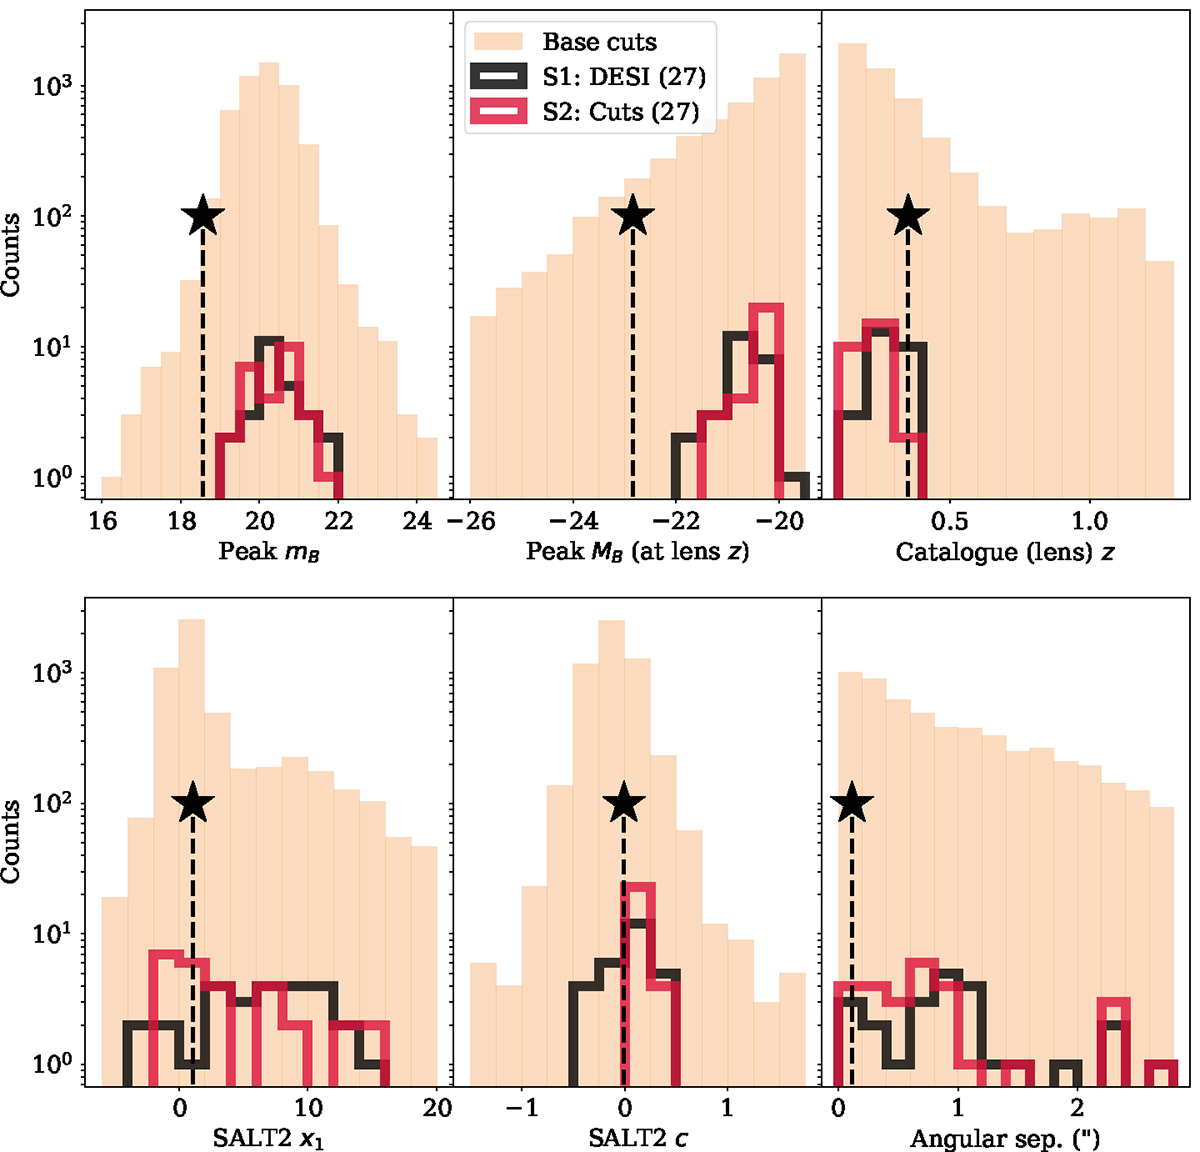
Fig. 10.
Download original image
Set of histograms displaying the distributions for peak mB, peak MB, lens z, SALT2 x1, SALT2 c, and angular separation values for the transients that passed the base cuts described in Sect. 4.1 (orange bars), and the candidates passing the two selection methods described in Sects. 4.2 and 4.3 (solid black and red lines, respectively). The dotted line with a star marker indicates the corresponding values for SN Zwicky for each distribution parameter.
Current usage metrics show cumulative count of Article Views (full-text article views including HTML views, PDF and ePub downloads, according to the available data) and Abstracts Views on Vision4Press platform.
Data correspond to usage on the plateform after 2015. The current usage metrics is available 48-96 hours after online publication and is updated daily on week days.
Initial download of the metrics may take a while.