Fig. 13.
Download original image
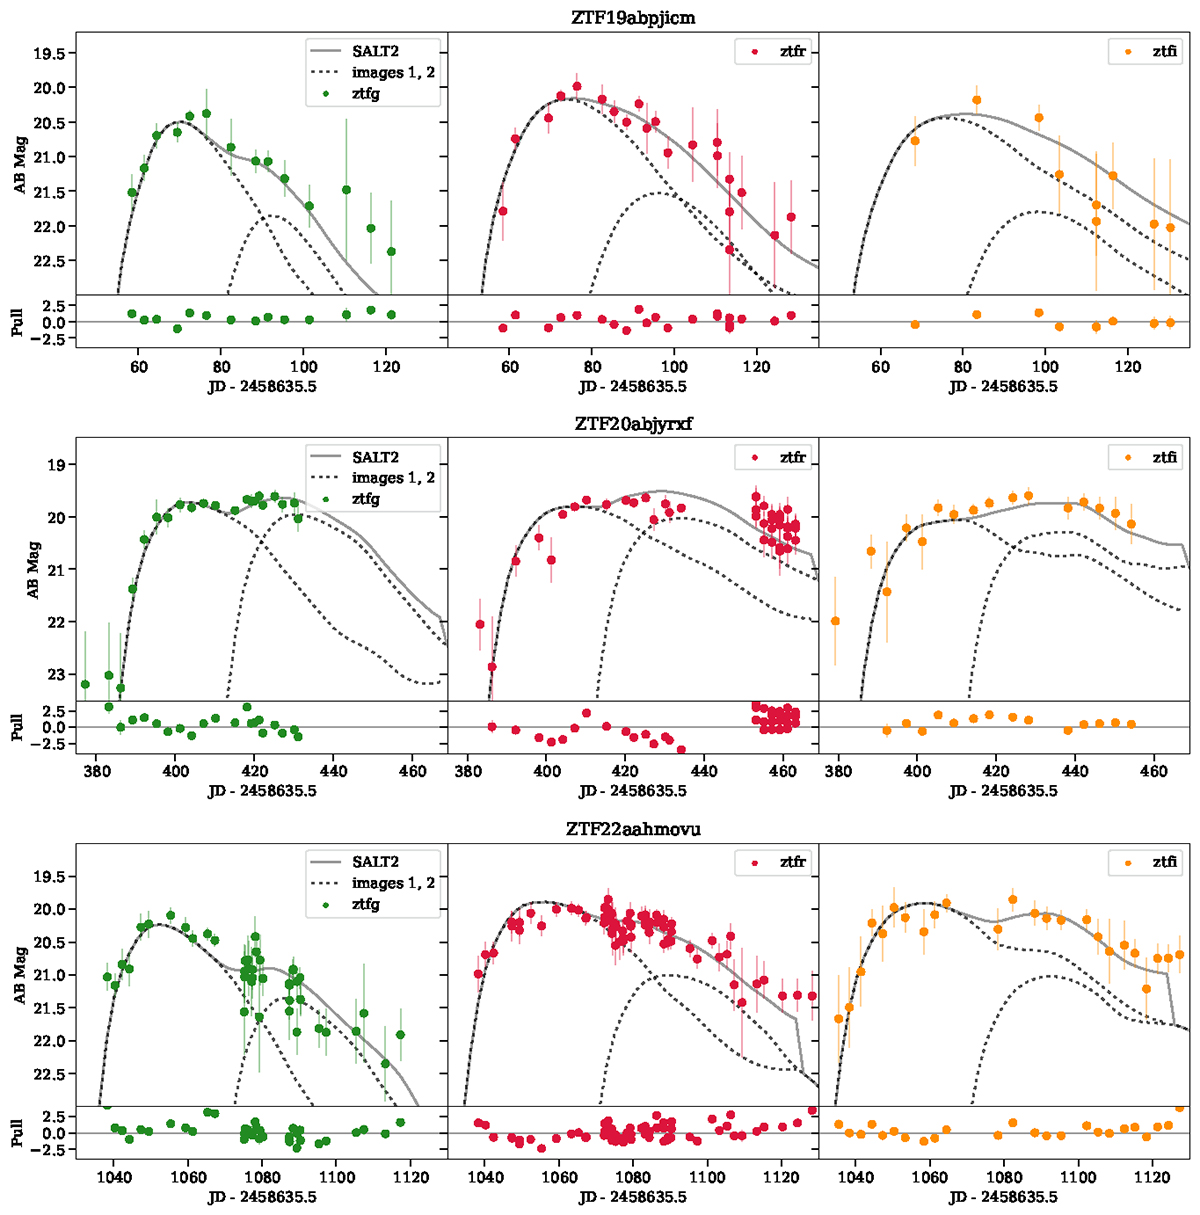
Two-image combined SALT2 template fits for the three candidates in the gold sample that had a reasonable fit; ZTF19abpjicm, ZTF20abjyrxf, and ZTF22aahmovu. Each plot shows the light curve in g-, r-, and i-bands, the best fit combined SALT2 model (solid grey line), and the model for each lensed image (dashed grey lines). The fit parameters are given in Table 6.
Current usage metrics show cumulative count of Article Views (full-text article views including HTML views, PDF and ePub downloads, according to the available data) and Abstracts Views on Vision4Press platform.
Data correspond to usage on the plateform after 2015. The current usage metrics is available 48-96 hours after online publication and is updated daily on week days.
Initial download of the metrics may take a while.