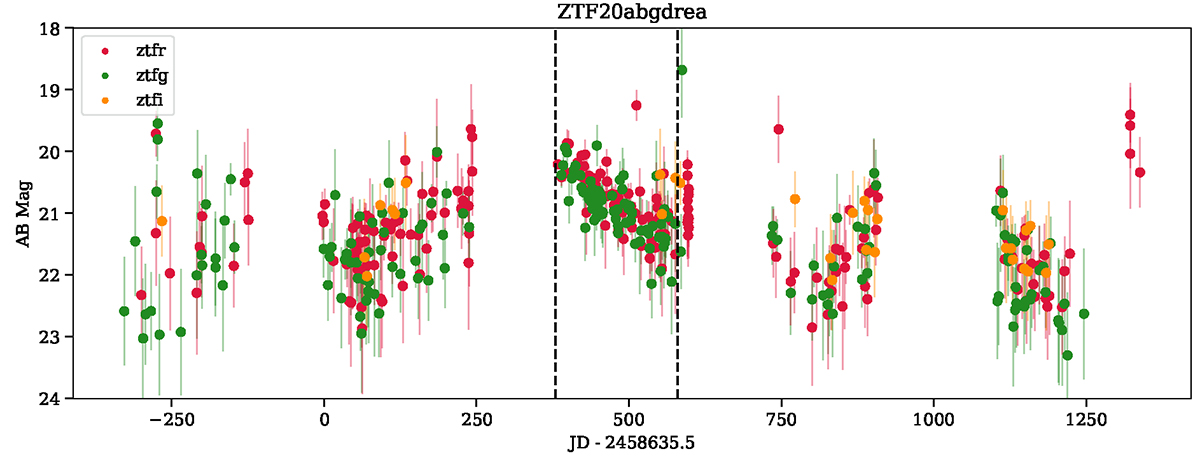
Fig. 4.
Download original image
Light curve of ZTF20abgdrea, a candidate that passed S1 and S2, but was removed during visual inspection due to the long-term variability that suggests it is a likely AGN or QSO. The dotted black lines indicate the section of the light curve that was selected by the pipeline for the SALT2 fit. The baseline was not removed from this forced photometry, to more clearly illustrate the variability.
Current usage metrics show cumulative count of Article Views (full-text article views including HTML views, PDF and ePub downloads, according to the available data) and Abstracts Views on Vision4Press platform.
Data correspond to usage on the plateform after 2015. The current usage metrics is available 48-96 hours after online publication and is updated daily on week days.
Initial download of the metrics may take a while.