Open Access
Fig. 8.
Download original image
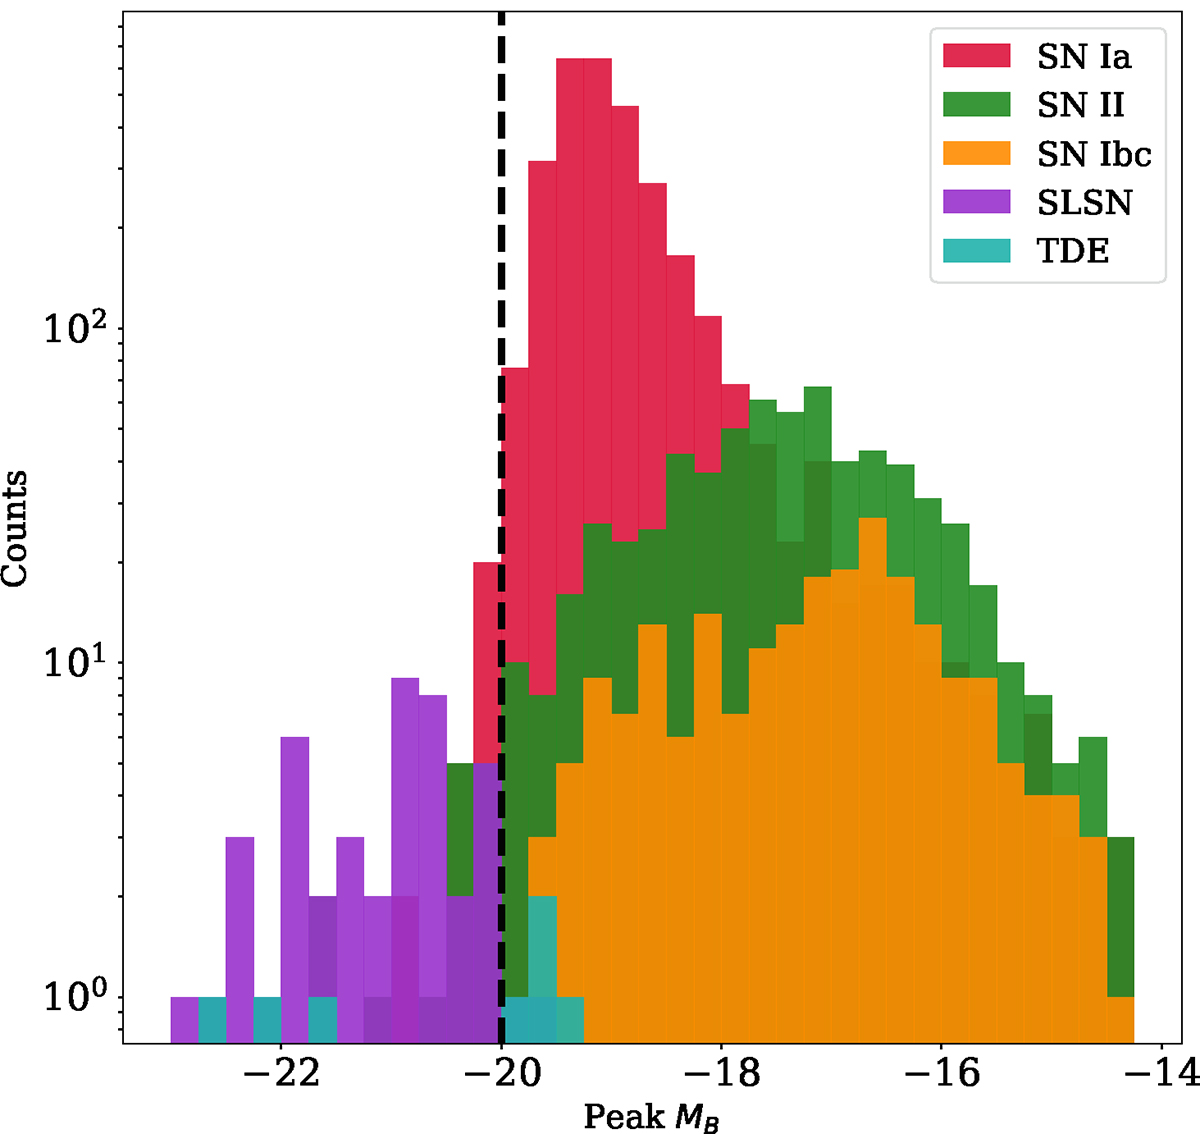
Histogram illustrating the peak B absolute magnitude distribution for the 5 main classes of transients (SN Ia, SN II, SN Ib/c, SLSNe, and TDEs) recorded by the BTS. The dashed black line illustrates the objects with MB < −20 mag.
Current usage metrics show cumulative count of Article Views (full-text article views including HTML views, PDF and ePub downloads, according to the available data) and Abstracts Views on Vision4Press platform.
Data correspond to usage on the plateform after 2015. The current usage metrics is available 48-96 hours after online publication and is updated daily on week days.
Initial download of the metrics may take a while.