Fig. 13.
Download original image
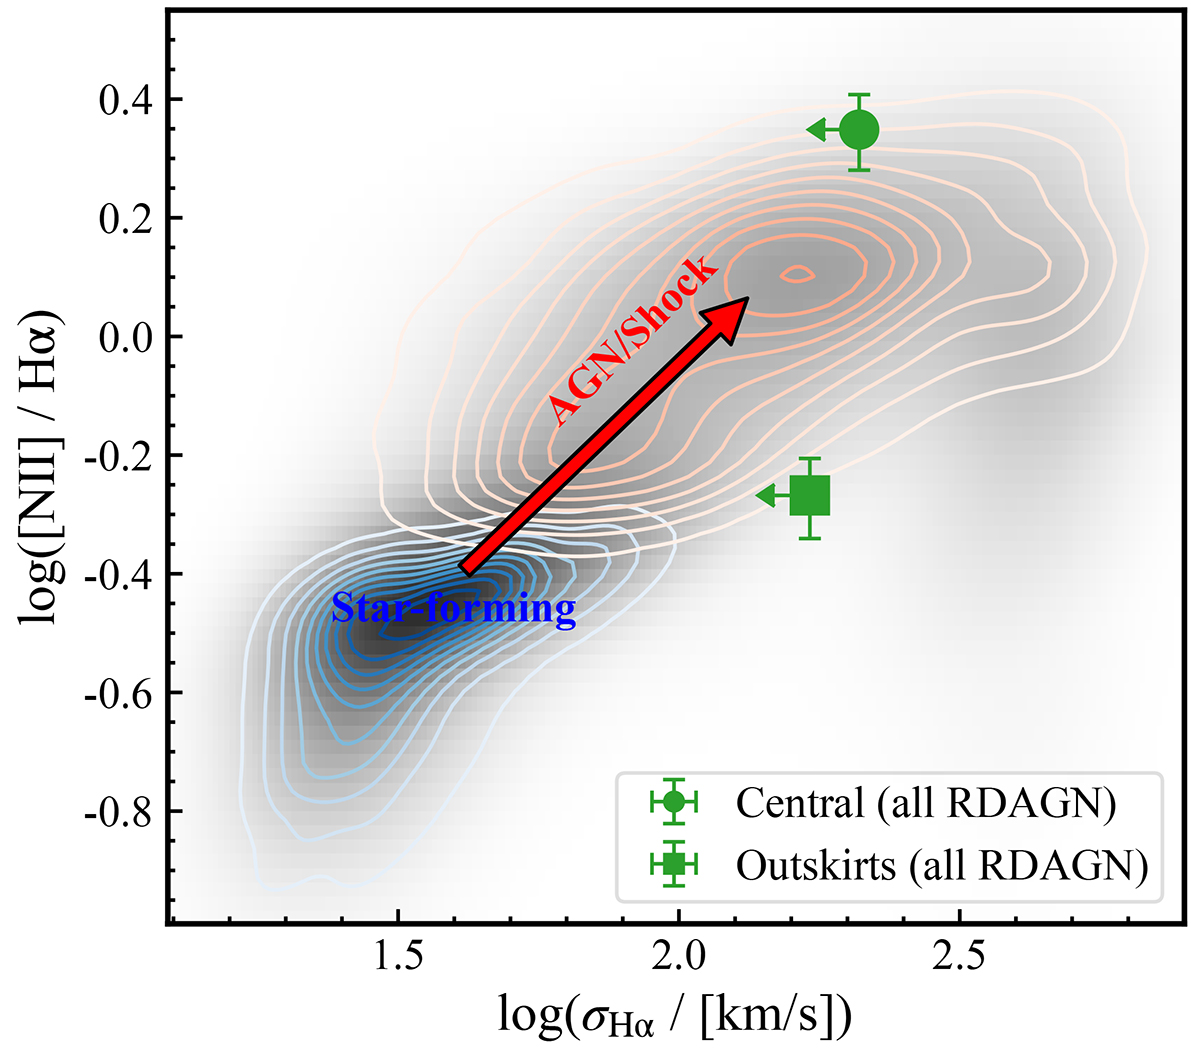
Ionization condition diagnostic of the emission line excess found in the nuclear regions of RDAGN hosts (green circle) as well as the deficiency found in the outskirts (green square). The green upper limits on σHα are due to the unknown level of line broadening after stacking the spectra. The background grayscale map is the distribution of the [N II]/Hα vs σHα for the whole MaNGA sample. Star-forming-like emission and AGN or shock-dominated emission regions as classified in the BPT diagram are plotted as blue and red contours, respectively. The red arrow indicates the direction in which the ionization becomes harder due to the AGN or shock contribution. In RDAGN hosts, the line ratio suggests that the nuclear emission line excess is created by AGN or shocks, while weaker star formation may be the reason for the emission line deficiency in the outskirts.
Current usage metrics show cumulative count of Article Views (full-text article views including HTML views, PDF and ePub downloads, according to the available data) and Abstracts Views on Vision4Press platform.
Data correspond to usage on the plateform after 2015. The current usage metrics is available 48-96 hours after online publication and is updated daily on week days.
Initial download of the metrics may take a while.