Fig. 11
Download original image
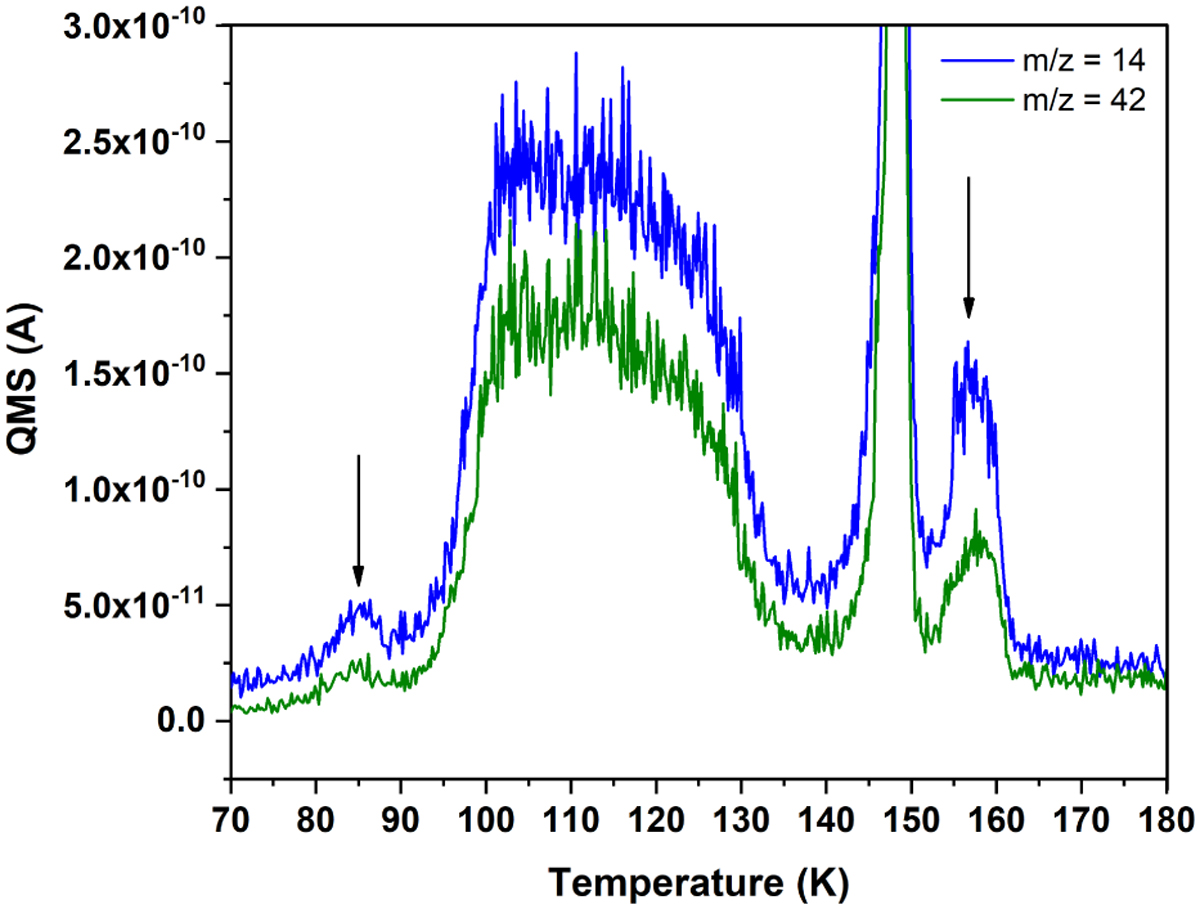
TPD-QMS profile for the m/z = 14 and 42. Black arrows correspond to features attributable to H2CCO, obtained after the reaction of the pre-deposited CH3CHO with H atoms on c-ASW at 10K. The desorption peaks at 100–130 K and 140–150 K are derived from the remaining CH3CHO on c-ASW after exposure to H atoms. The peaks at 75–90 K and 150–165 K represent the desorption of H2CCO (Maity et al. 2015; Chuang et al. 2020; Fedoseev et al. 2022).
Current usage metrics show cumulative count of Article Views (full-text article views including HTML views, PDF and ePub downloads, according to the available data) and Abstracts Views on Vision4Press platform.
Data correspond to usage on the plateform after 2015. The current usage metrics is available 48-96 hours after online publication and is updated daily on week days.
Initial download of the metrics may take a while.