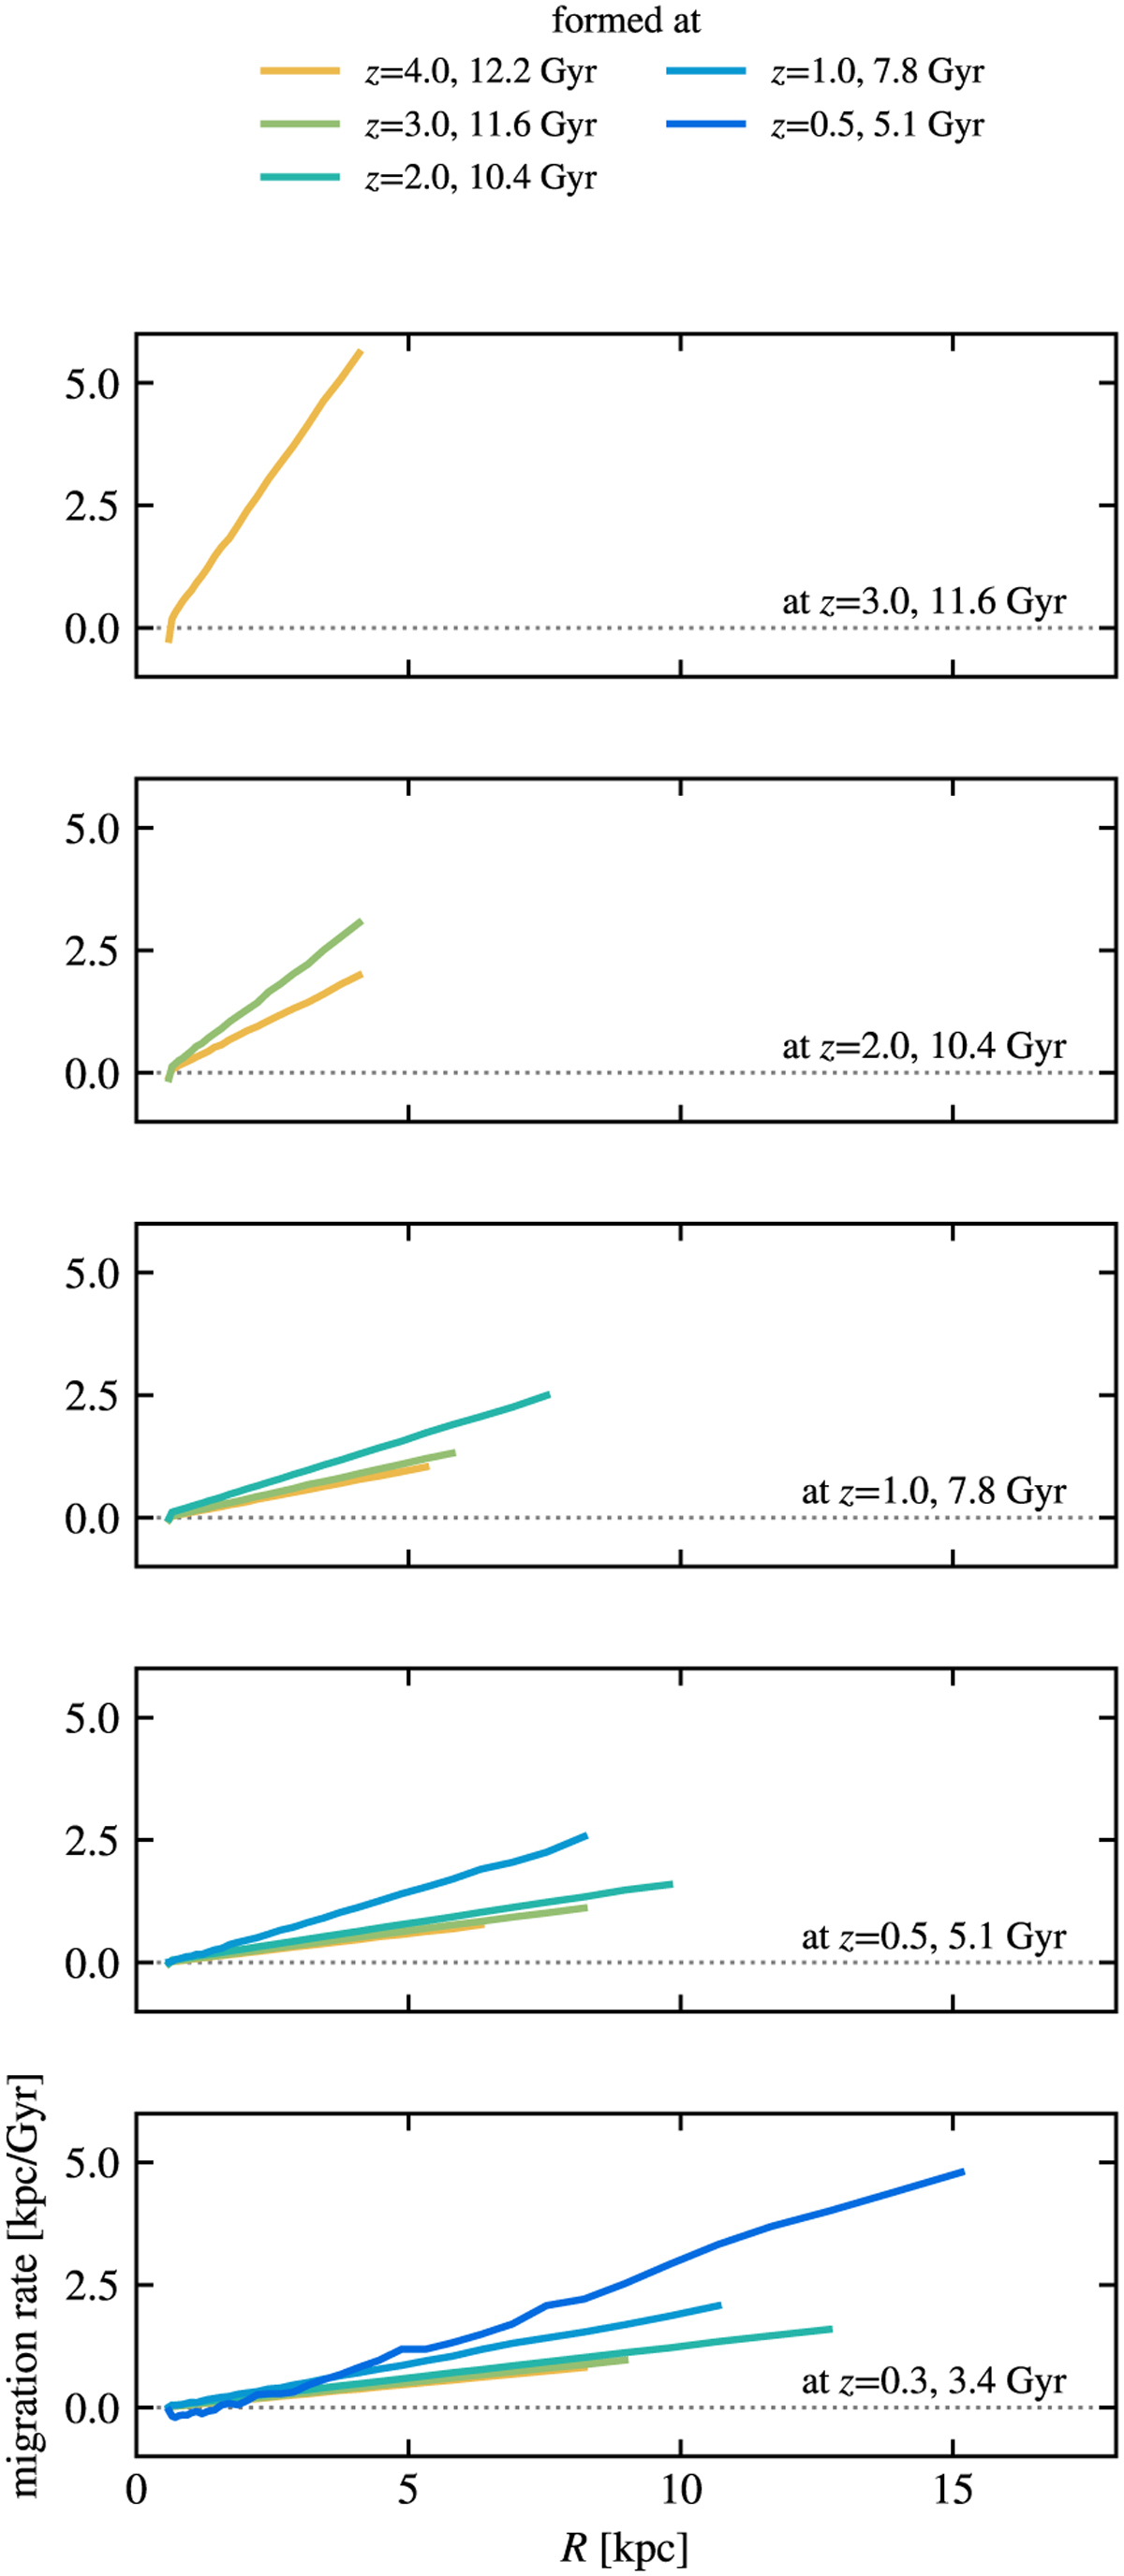
Fig. 7
Download original image
Median radial migration rate of stars. As in Figure 6, each color corresponds to a population of stars, followed at different epochs (different panels). The quantity plotted is the median of the difference between the radius at the given epoch (the quantity on the x-axis) and the birth radius, divided by the time difference between the two epochs, with the convention of a positive value for an outward migration. By considering the instantaneous radius (instead of the average), the migration measured here includes both the blurring and churning effects.
Current usage metrics show cumulative count of Article Views (full-text article views including HTML views, PDF and ePub downloads, according to the available data) and Abstracts Views on Vision4Press platform.
Data correspond to usage on the plateform after 2015. The current usage metrics is available 48-96 hours after online publication and is updated daily on week days.
Initial download of the metrics may take a while.