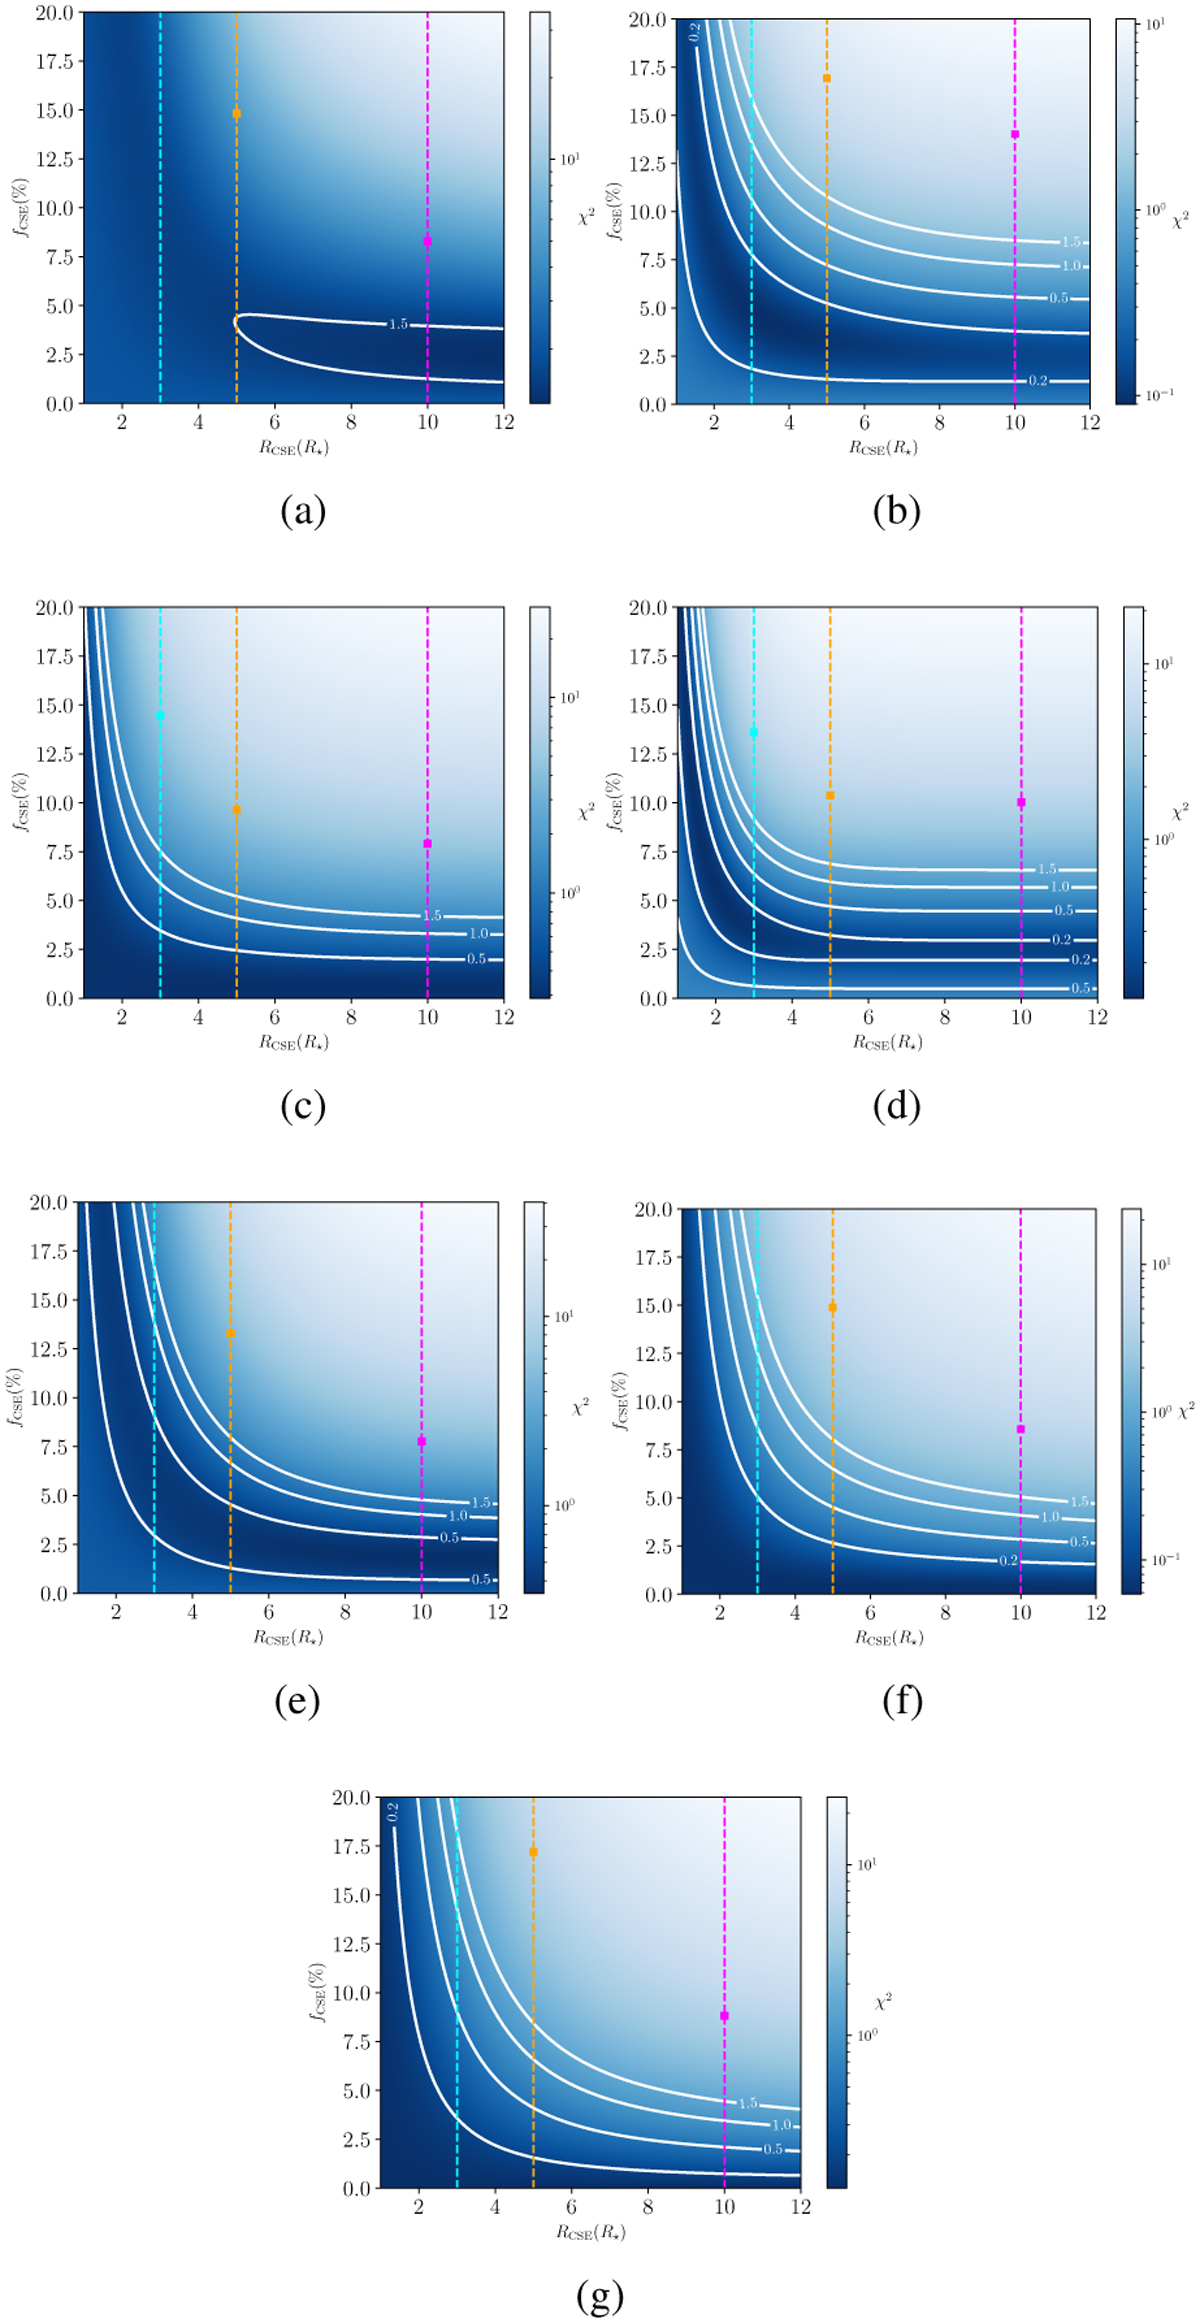
Fig. 7
Download original image
Reduced χ2 map as a function of the flux contribution fCSE and FWHM (RCSE) of the Gaussian CSE model in the L and M bands: U Aql, 7.02 d (a), η Aql, 7.17 d (b), β Dor, 9.84 d (c), ζ Gem, 10.15 d (d), TT Aql, 13.75 d (e), T Mon, 27.03 d (f), and U Car, 38.87 d (g). The dashed cyan, orange, and purple lines represent different CSE radii (FWHM) for which we provide the upper limit on the CSE flux contribution. It is displayed as a square (see Table 5). The weak flux contribution (<5%) does not permit us to constrain the CSE dimensions. Conversely, the flux of the compact envelope (<3–4 R⋆) cannot be determined. Large and bright models (R>10 R⋆f > 10%, purple squares) can be excluded, however.
Current usage metrics show cumulative count of Article Views (full-text article views including HTML views, PDF and ePub downloads, according to the available data) and Abstracts Views on Vision4Press platform.
Data correspond to usage on the plateform after 2015. The current usage metrics is available 48-96 hours after online publication and is updated daily on week days.
Initial download of the metrics may take a while.