Fig. 1
Download original image
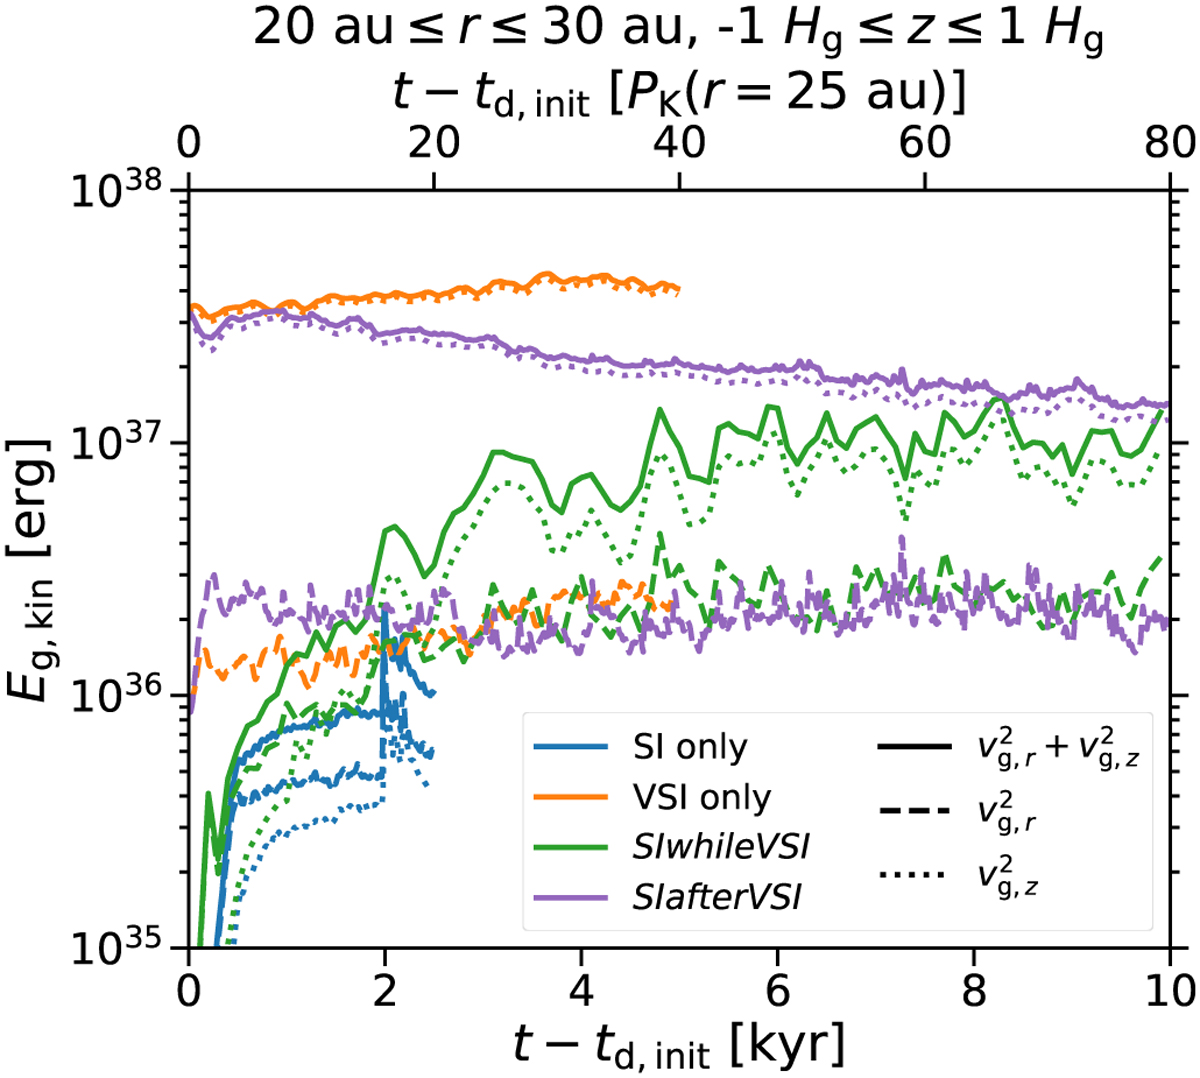
Total gas kinetic energy Eg,kin in the region between r = 20 au and 30 au and restricted to one gas scale height off the mid-plane as a function of time t after the initialisation of the dust particles at td,init. Differently coloured lines represent simulations of the streaming instability and the vertical shear instability in isolation as well as of the scenarios SIwhileVSI and SIafterVSI, respectively, with the dust size being equal to 3 cm in all simulations. Like the model including only the vertical shear instability, the scenario SIafterVSI as well as the scenario SIwhileVSI at late times are characterised by a comparatively high total energy, with the energy of the vertical motions being substantially higher than that of the radial motions. In comparison, the total energy is less in the model of the streaming instability and in the scenario SIwhileVSI at early times, but largely equally distributed among the radial and vertical velocity components.
Current usage metrics show cumulative count of Article Views (full-text article views including HTML views, PDF and ePub downloads, according to the available data) and Abstracts Views on Vision4Press platform.
Data correspond to usage on the plateform after 2015. The current usage metrics is available 48-96 hours after online publication and is updated daily on week days.
Initial download of the metrics may take a while.