Fig. 3
Download original image
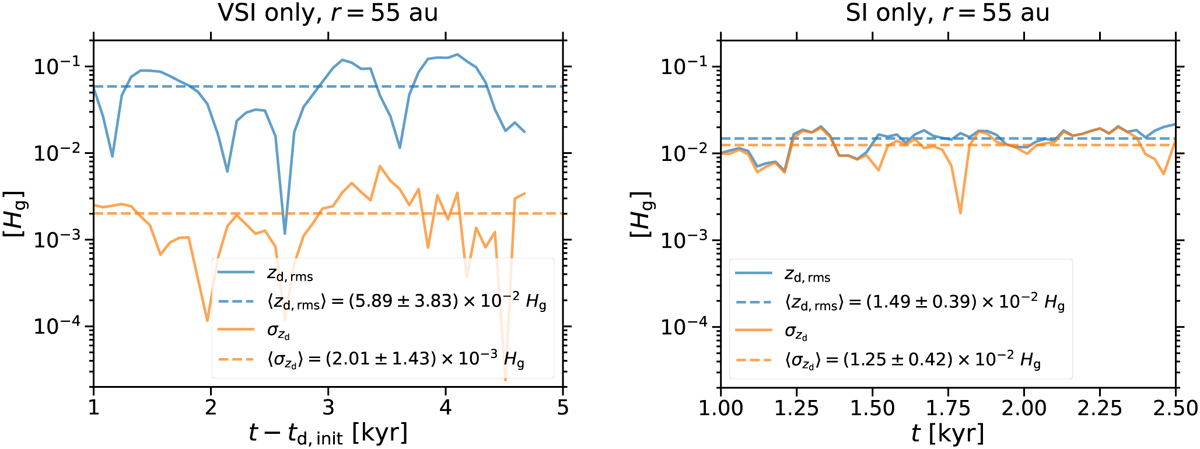
Root mean square zd,rms (blue solid line) and standard deviation σzd (orange solid line) of the vertical dust particle positions as functions of time, considering only the time after dust settling. The mean of each quantity is shown as a dashed line. The left and right panel depict simulations of the vertical shear instability and the streaming instability with 3 cm-sized dust. The average root mean square is more than an order of magnitude greater than the standard deviation in former simulation, while they are similar in the latter simulation.
Current usage metrics show cumulative count of Article Views (full-text article views including HTML views, PDF and ePub downloads, according to the available data) and Abstracts Views on Vision4Press platform.
Data correspond to usage on the plateform after 2015. The current usage metrics is available 48-96 hours after online publication and is updated daily on week days.
Initial download of the metrics may take a while.