Fig. B.1.
Download original image
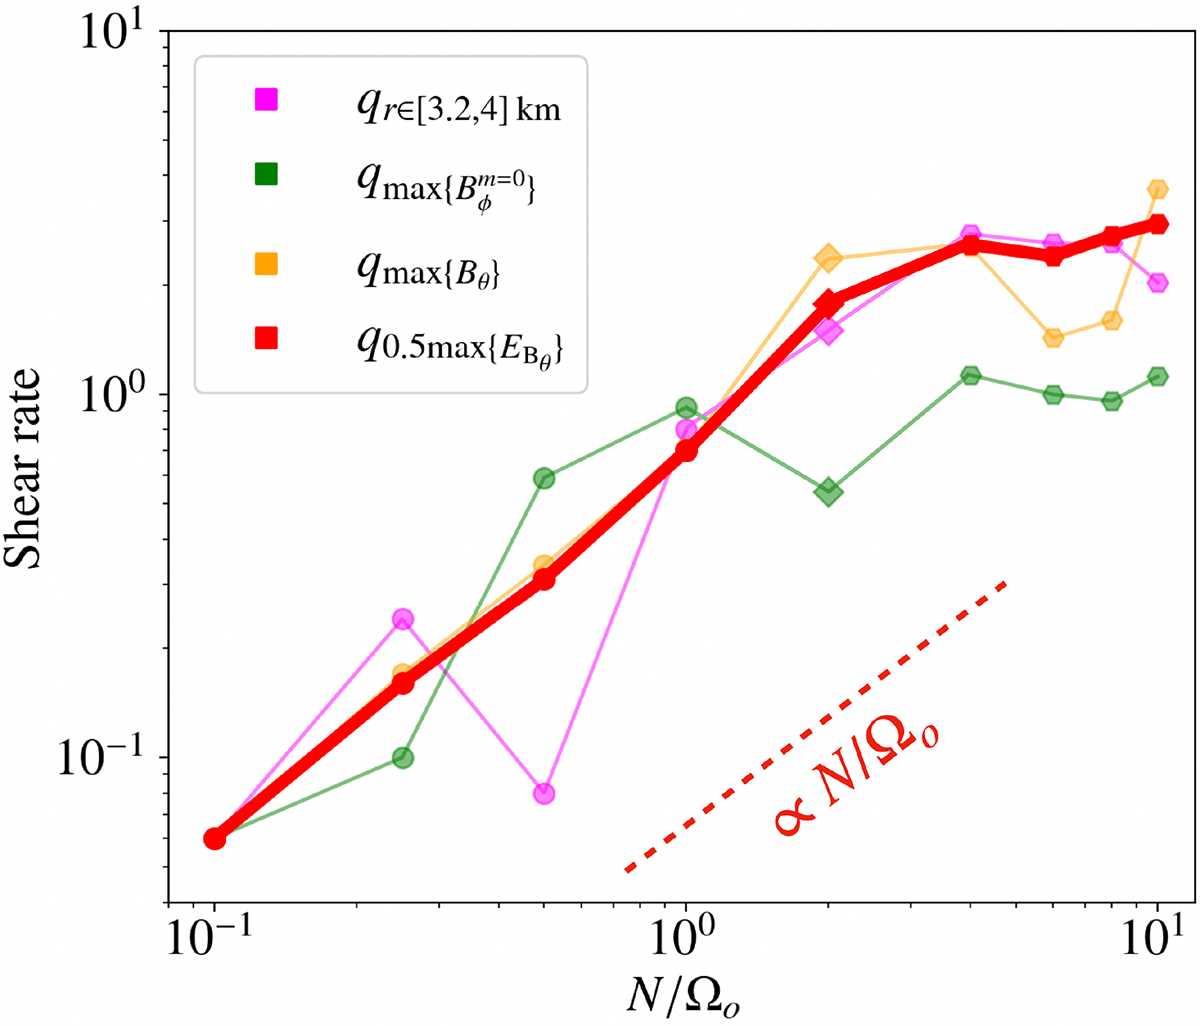
Shear rates q measured locally in the simulations as a function of N/Ωo. The different colours represent distinct methods to measure q: slope in the rotation profile between 3.2 and 4 km (pink), q at the maximum of ![]() and Bθ (green and orange, respectively), and slope in the range of radii where half of the Tayler mode energy (approximated by the latitudinal magnetic energy EBθ) is concentrated around its maximum (red).
and Bθ (green and orange, respectively), and slope in the range of radii where half of the Tayler mode energy (approximated by the latitudinal magnetic energy EBθ) is concentrated around its maximum (red).
Current usage metrics show cumulative count of Article Views (full-text article views including HTML views, PDF and ePub downloads, according to the available data) and Abstracts Views on Vision4Press platform.
Data correspond to usage on the plateform after 2015. The current usage metrics is available 48-96 hours after online publication and is updated daily on week days.
Initial download of the metrics may take a while.