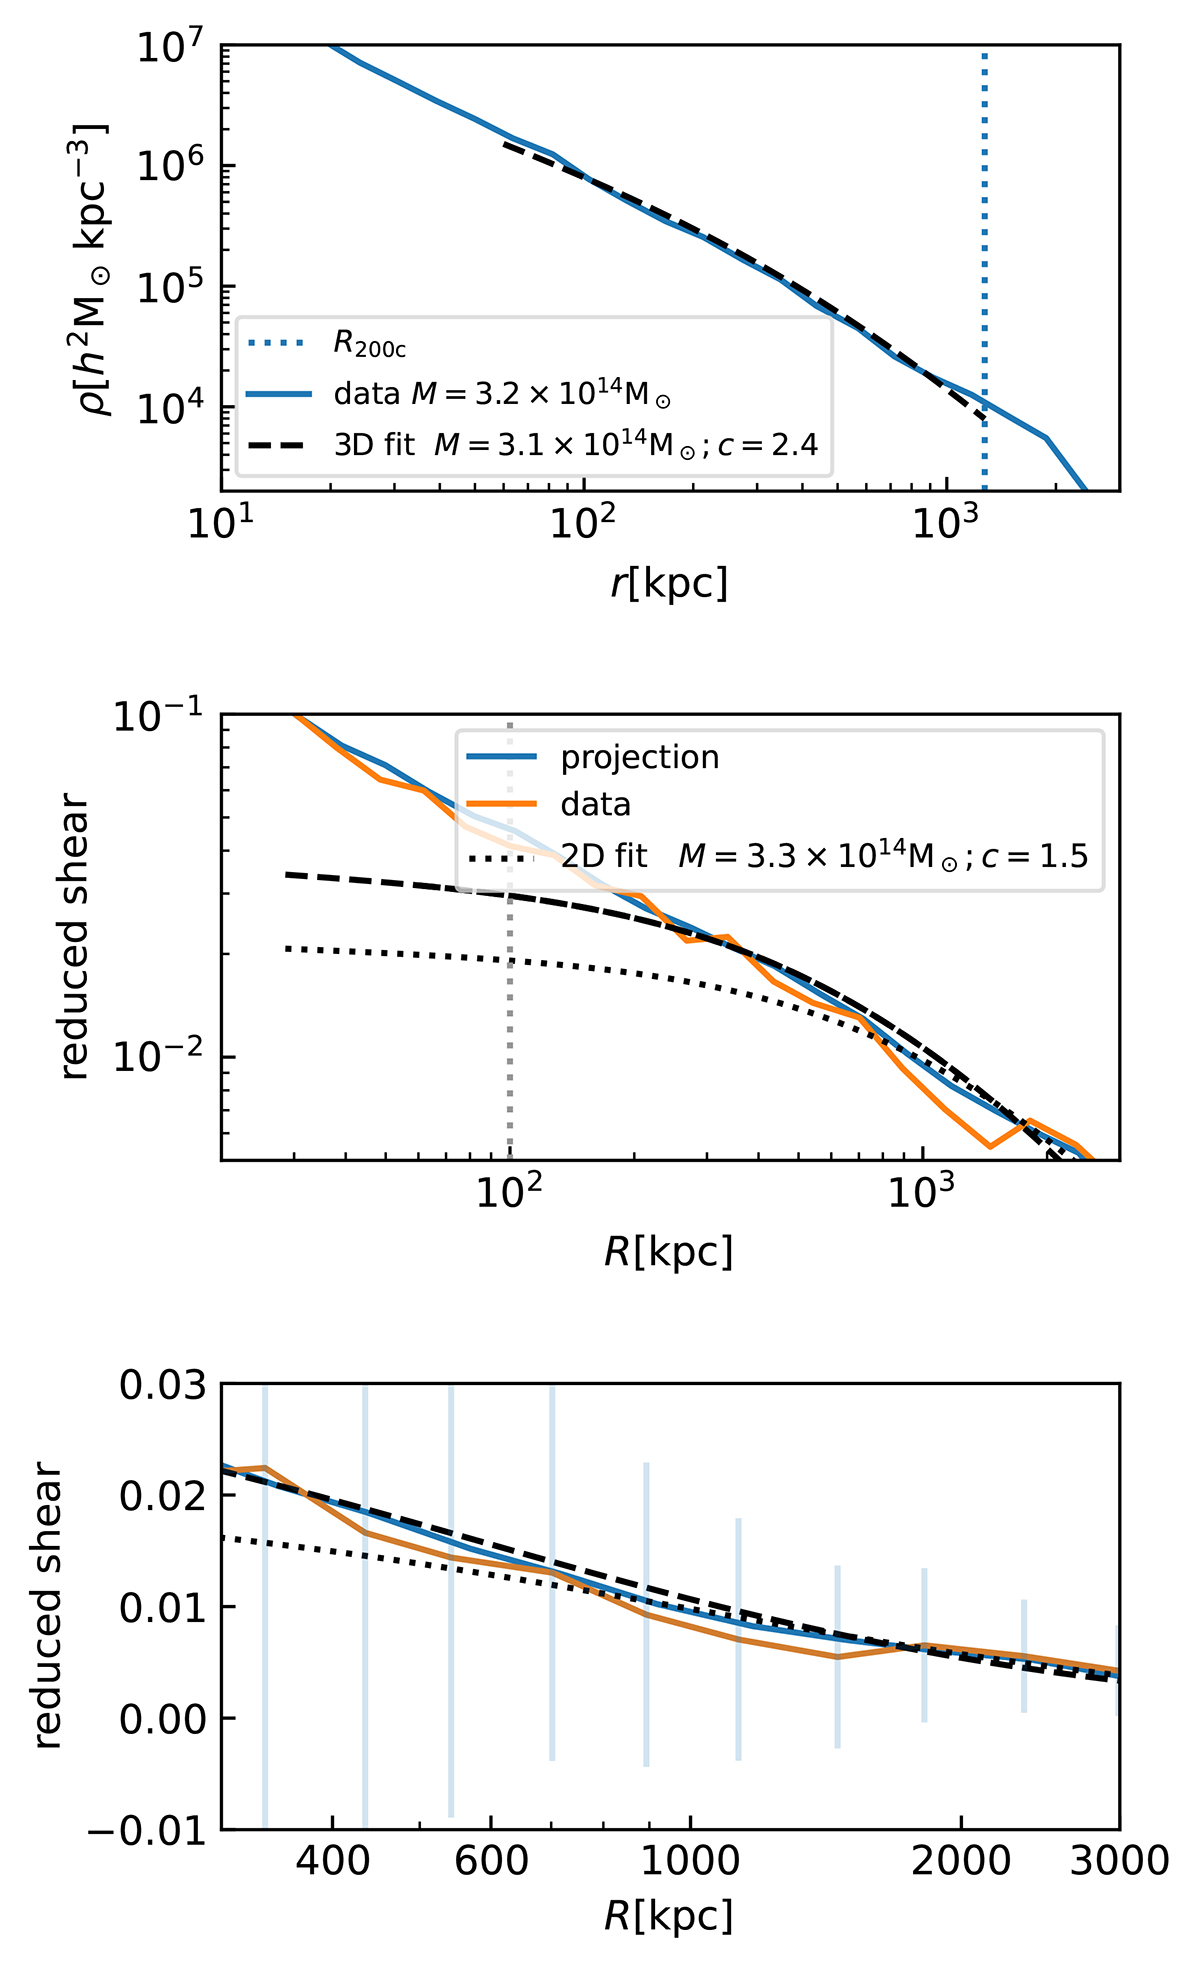
Fig. A.1.
Download original image
Density profiles of a simulated halo and the corresponding NFW profile fit. Upper panel: total matter density profile (blue solid line) and the respective NFW profile fit profile (black dashed line). Central panel: reduced shear from simulated particles (orange solid line), and from the analytical projection of the density profile Σconv. presented in Eq. (A.1) and performed in the radial range [60, 3000] kpc, in the blue solid line. The dashed vertical line indicates the minimum radius of the shear fit, and the fit profiles (black lines) are extrapolated down to 10 kpc to enhance the central densities predicted by the two fits. The bottom panel shows the same as the central panel but focuses on the radial range of the fit. The error bars indicate the uncertainty for each radial bin, as defined in Eq. (8).
Current usage metrics show cumulative count of Article Views (full-text article views including HTML views, PDF and ePub downloads, according to the available data) and Abstracts Views on Vision4Press platform.
Data correspond to usage on the plateform after 2015. The current usage metrics is available 48-96 hours after online publication and is updated daily on week days.
Initial download of the metrics may take a while.