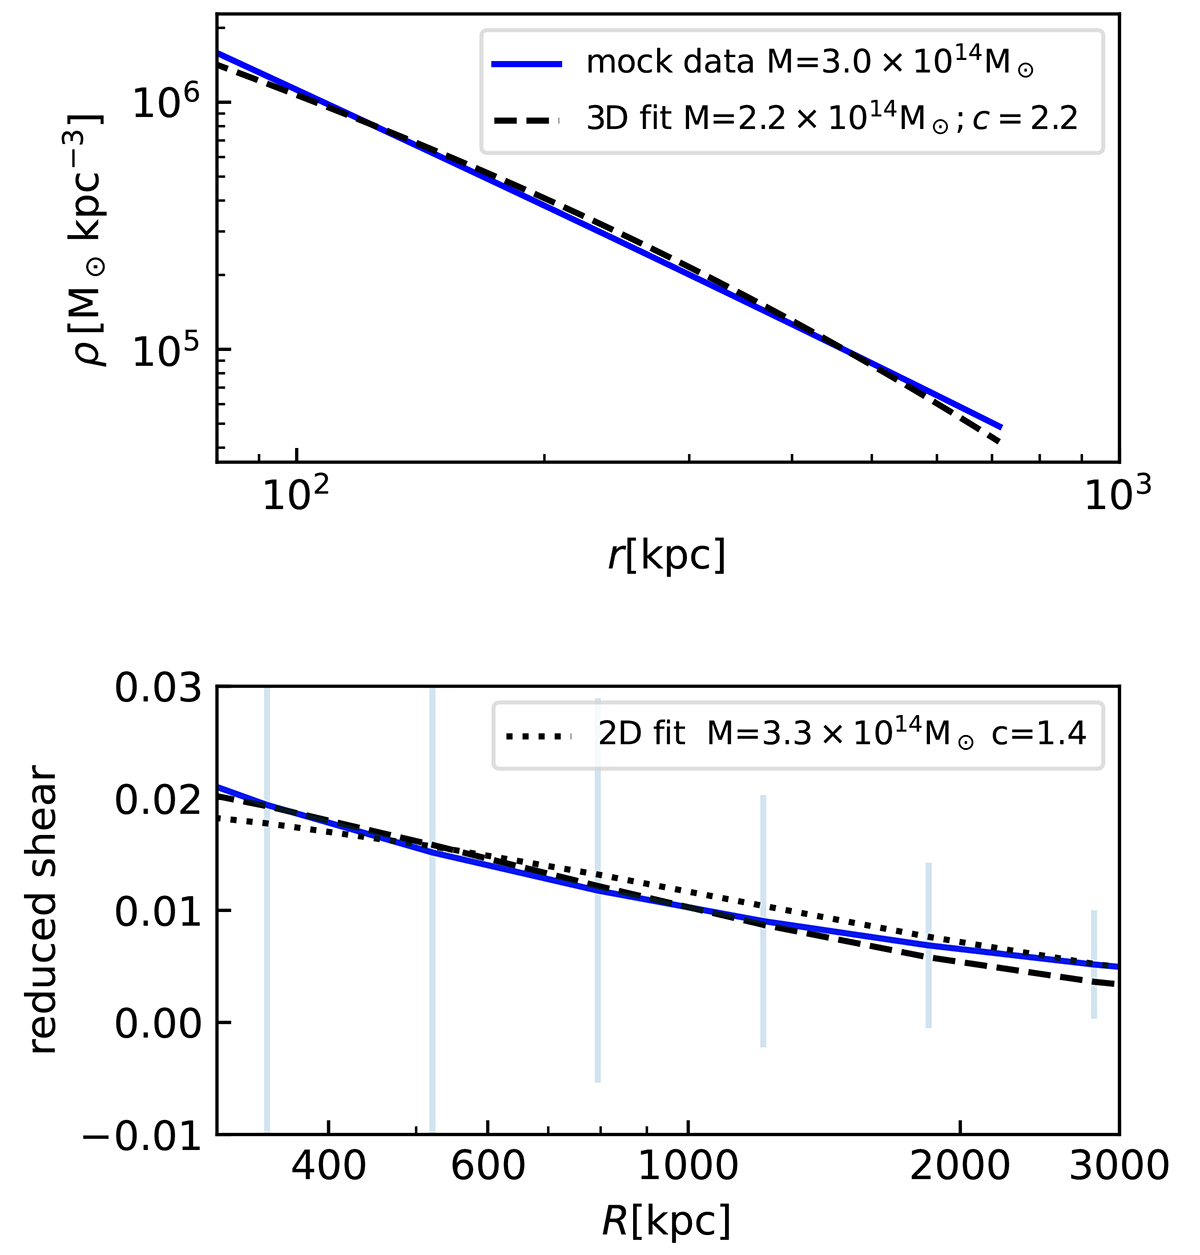
Fig. A.2.
Download original image
Density profiles of a mock halo that deviates from NFW and the corresponding NFW profile fit. The mock halo mass, concentration parameter and gNFW log-slopes are chosen to match the ones of the simulated halo presented in Fig. A.1. The upper panel reports the total matter density profile of the mock halo (solid blue line) and the profile from the corresponding NFW profile fit (dashed black line). The bottom panel shows the reduced shear and the profile from the corresponding NFW profile fit (dotted black line). The error bars indicate the uncertainty for each radial bin, as defined in Eq. (8).
Current usage metrics show cumulative count of Article Views (full-text article views including HTML views, PDF and ePub downloads, according to the available data) and Abstracts Views on Vision4Press platform.
Data correspond to usage on the plateform after 2015. The current usage metrics is available 48-96 hours after online publication and is updated daily on week days.
Initial download of the metrics may take a while.