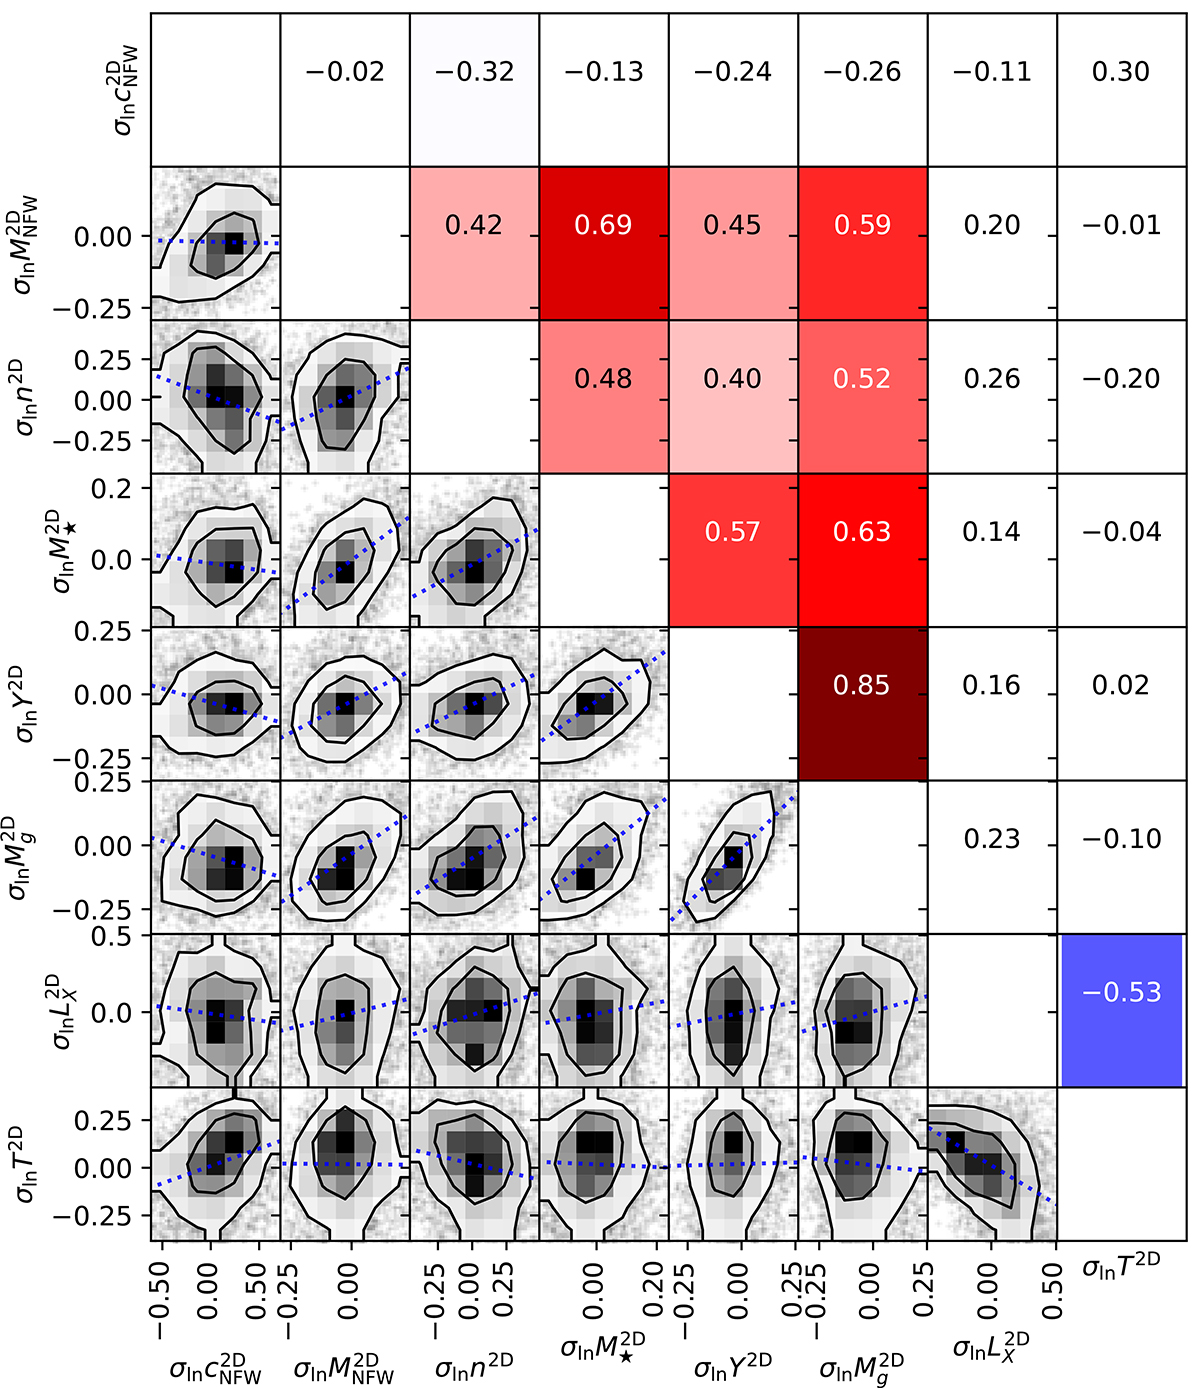
Fig. B.1.
Download original image
Correlation coefficients matrix (upper-right triangle) and scatter plot (bottom-left triangle) of power-law log-residuals of Euclid-data (lensing concentration, lensing mass, richness, and stellar mass, respectively) and possible outcomes from multi-wavelength observations (integrated Compton-y parameter, gas mass, X-ray luminosity, and temperature, respectively). Cell colouring goes from blue (negative correlation coefficients) to red (positive correlation coefficients) and is white in the interval [ − 0.35, 0.35] in order to enhance the visibility of the most significant coefficients.
Current usage metrics show cumulative count of Article Views (full-text article views including HTML views, PDF and ePub downloads, according to the available data) and Abstracts Views on Vision4Press platform.
Data correspond to usage on the plateform after 2015. The current usage metrics is available 48-96 hours after online publication and is updated daily on week days.
Initial download of the metrics may take a while.