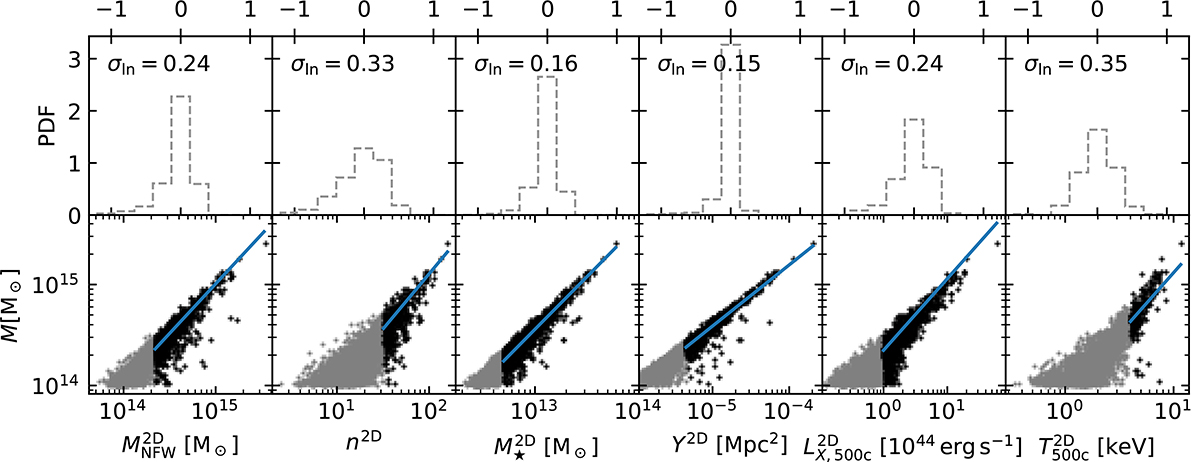
Fig. B.8.
Download original image
Halo masses at fixed observable properties. We report the lensing mass, lensing richness, projected stellar mass, projected integrated Compton-y, projected X-ray luminosity, and projected temperature in each column, respectively. The top panel shows residuals of the observable-mass relations and respective scatter of log-residuals σln, and its axes are on the upper part of the plot. The bottom panel shows the scaling relation fit (blue solid line); the data used to perform the fit (black data points) over-plotted on top of the total sample (grey data points) of the mass M as a function of the observable properties.
Current usage metrics show cumulative count of Article Views (full-text article views including HTML views, PDF and ePub downloads, according to the available data) and Abstracts Views on Vision4Press platform.
Data correspond to usage on the plateform after 2015. The current usage metrics is available 48-96 hours after online publication and is updated daily on week days.
Initial download of the metrics may take a while.