Fig. 3.
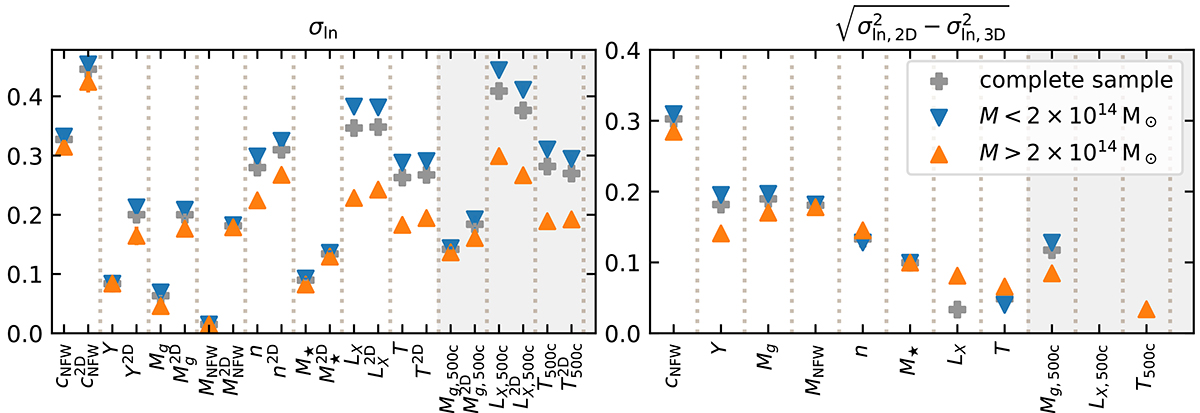
Download original image
Scatter of our mass-observable relations, paired with their projected version: concentration, integrated Compton-y parameter, gas mass, NFW mass, richness, stellar mass, X-ray luminosity, and temperature, within a radius of r200c; the grey band reports the gas mass, X-ray luminosity, and temperature within r500c. The left panel reports the fractional scatter of both 3D and 2D quantities. Each dotted vertical line separates the regions that report a given quantity and its 2D version. The right panel reports the contribution of projection effects. Points are coloured by their mass range as in Fig. 1, blue inverted triangles represent the low mass bin, orange up-triangles represent the high mass bin, and grey crosses represent the complete sample. Note: we lack the value of projection effects for LX, 500c (see discussion). Points are ordered according to the value of the second panel. Error bars are computed using the jackknife method.
Current usage metrics show cumulative count of Article Views (full-text article views including HTML views, PDF and ePub downloads, according to the available data) and Abstracts Views on Vision4Press platform.
Data correspond to usage on the plateform after 2015. The current usage metrics is available 48-96 hours after online publication and is updated daily on week days.
Initial download of the metrics may take a while.