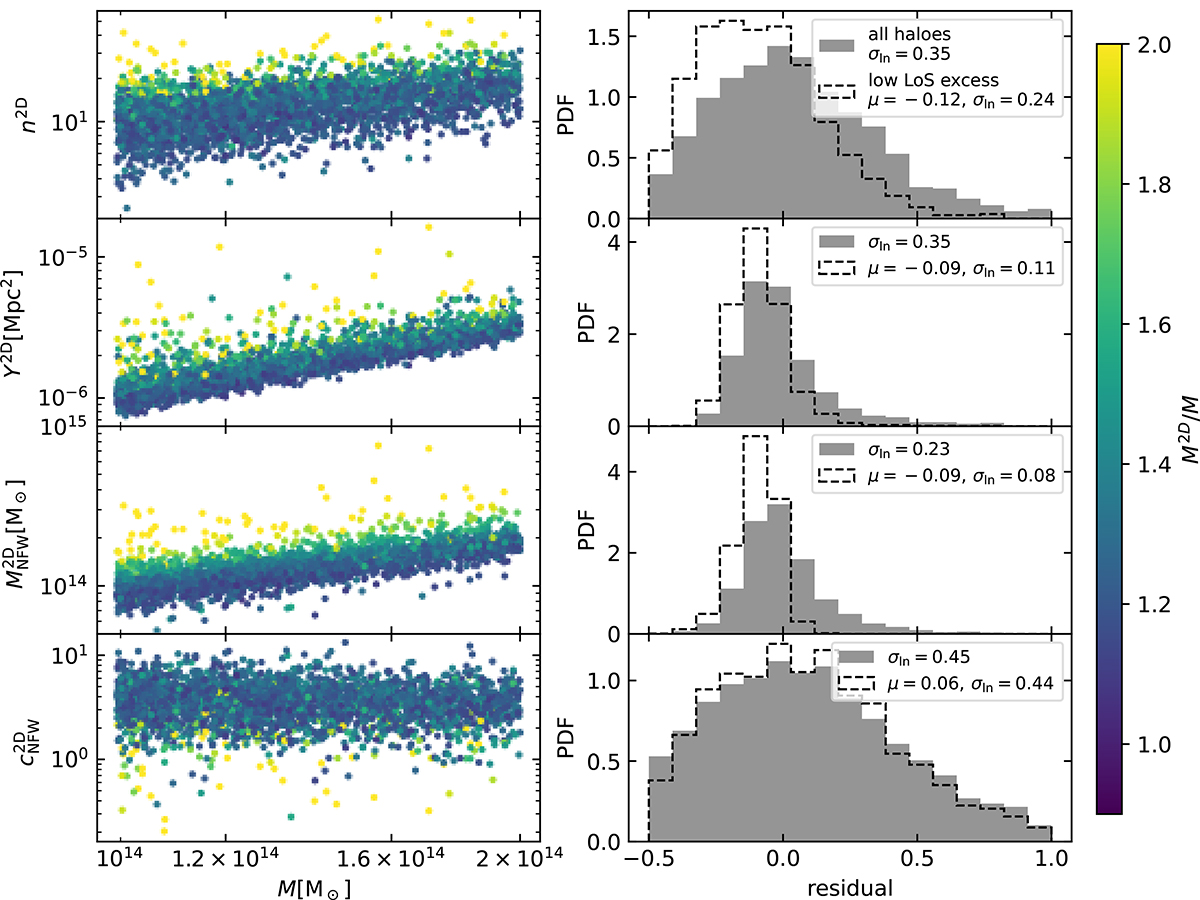
Fig. 7.
Download original image
Impact of LoS contamination in scaling relations. We show halo properties as a function of halo mass M in the left column, and colour-coded by the fractional amount of mass in a cylinder (M2D/M), and the residuals PDFs in the right column (grey shaded histogram). Rows correspond to richness, the integrated Compton-y parameter, lensing mass, and lensing concentration. We also show the residuals of a subset of halos with low LoS contamination (in particular M2D/M < 1.26, dashed line histogram). Each panel reports the scatter of the residuals σ and the mean μ of the low LoS residuals.
Current usage metrics show cumulative count of Article Views (full-text article views including HTML views, PDF and ePub downloads, according to the available data) and Abstracts Views on Vision4Press platform.
Data correspond to usage on the plateform after 2015. The current usage metrics is available 48-96 hours after online publication and is updated daily on week days.
Initial download of the metrics may take a while.