Open Access
Fig. 9.
Download original image
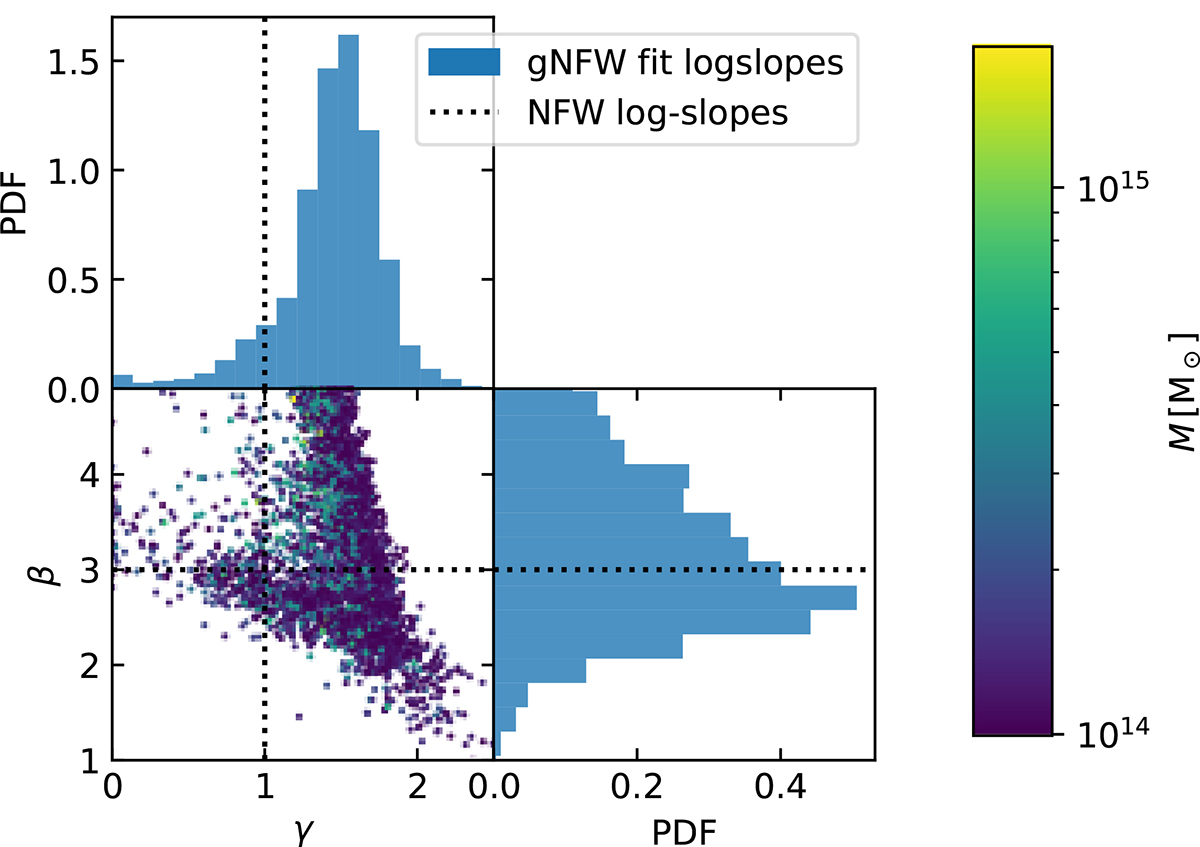
Probability density distribution of the parameters γ (inner slope, upper panel) and β (outer slope, right panel) of Eq. (10) of the successful gNFW profile fits. The central panel shows the scatter plot between the two parameters colour-coded by M. The dotted lines show the NFW parameters γ = 1 and β = 3.
Current usage metrics show cumulative count of Article Views (full-text article views including HTML views, PDF and ePub downloads, according to the available data) and Abstracts Views on Vision4Press platform.
Data correspond to usage on the plateform after 2015. The current usage metrics is available 48-96 hours after online publication and is updated daily on week days.
Initial download of the metrics may take a while.