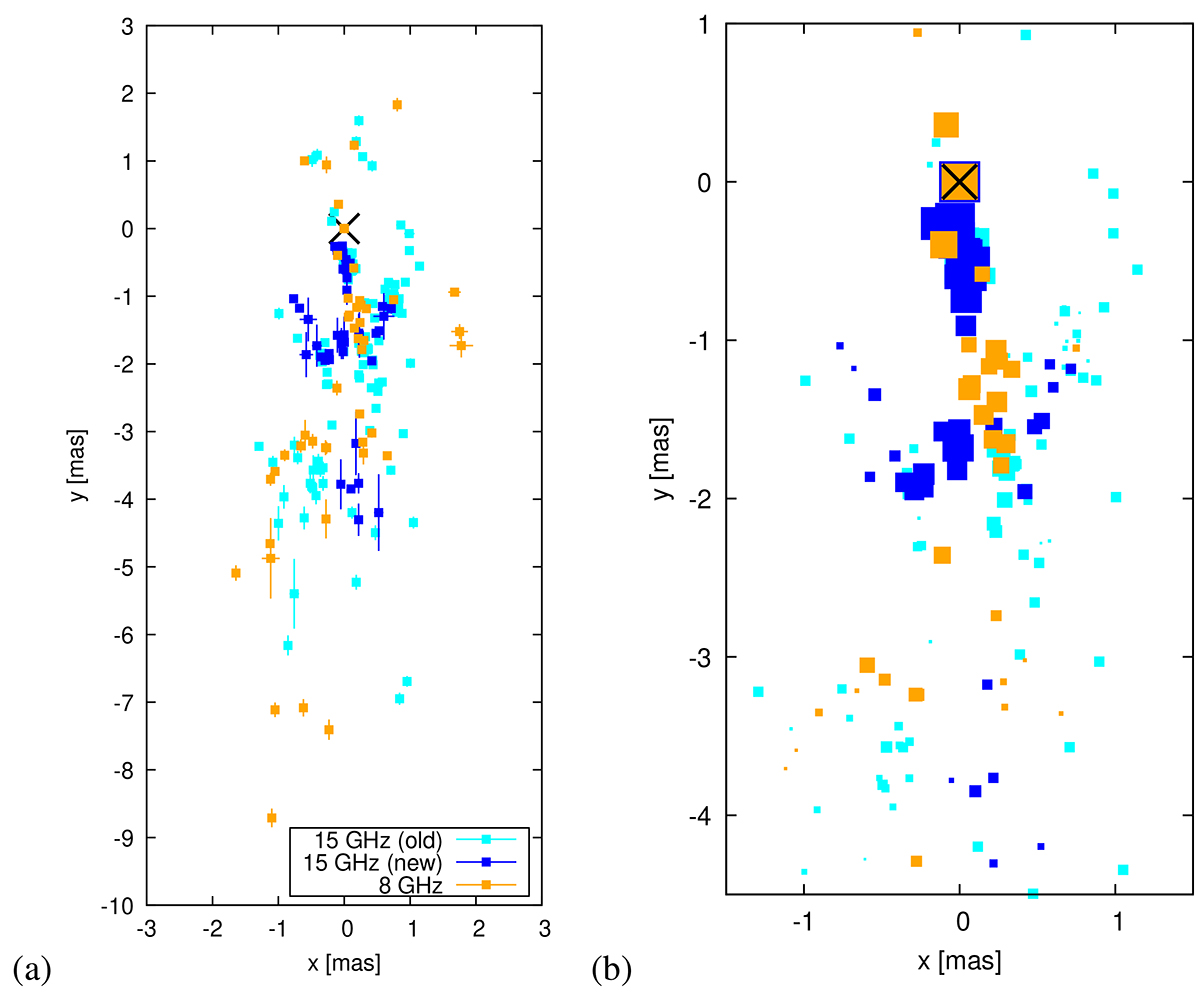
Fig. 2.
Download original image
All radio component positions in xy-coordinates. Light blue symbols denote the 15 GHz data from Britzen et al. (2019a), and dark blue and orange the new 15 GHz and 8 GHz results obtained in this study. In panel a the symbols are of equal size, while in panel b they are scaled according to the flux density (log). A zoomed-in view of the central region is shown, and all components below a flux limit of 1 Jy are displayed. For better visibility, the core flux has been removed. In this and all subsequent figures, the core position is marked with a black cross. The data of the two plots are available in TablesC.1 and C.2.
Current usage metrics show cumulative count of Article Views (full-text article views including HTML views, PDF and ePub downloads, according to the available data) and Abstracts Views on Vision4Press platform.
Data correspond to usage on the plateform after 2015. The current usage metrics is available 48-96 hours after online publication and is updated daily on week days.
Initial download of the metrics may take a while.