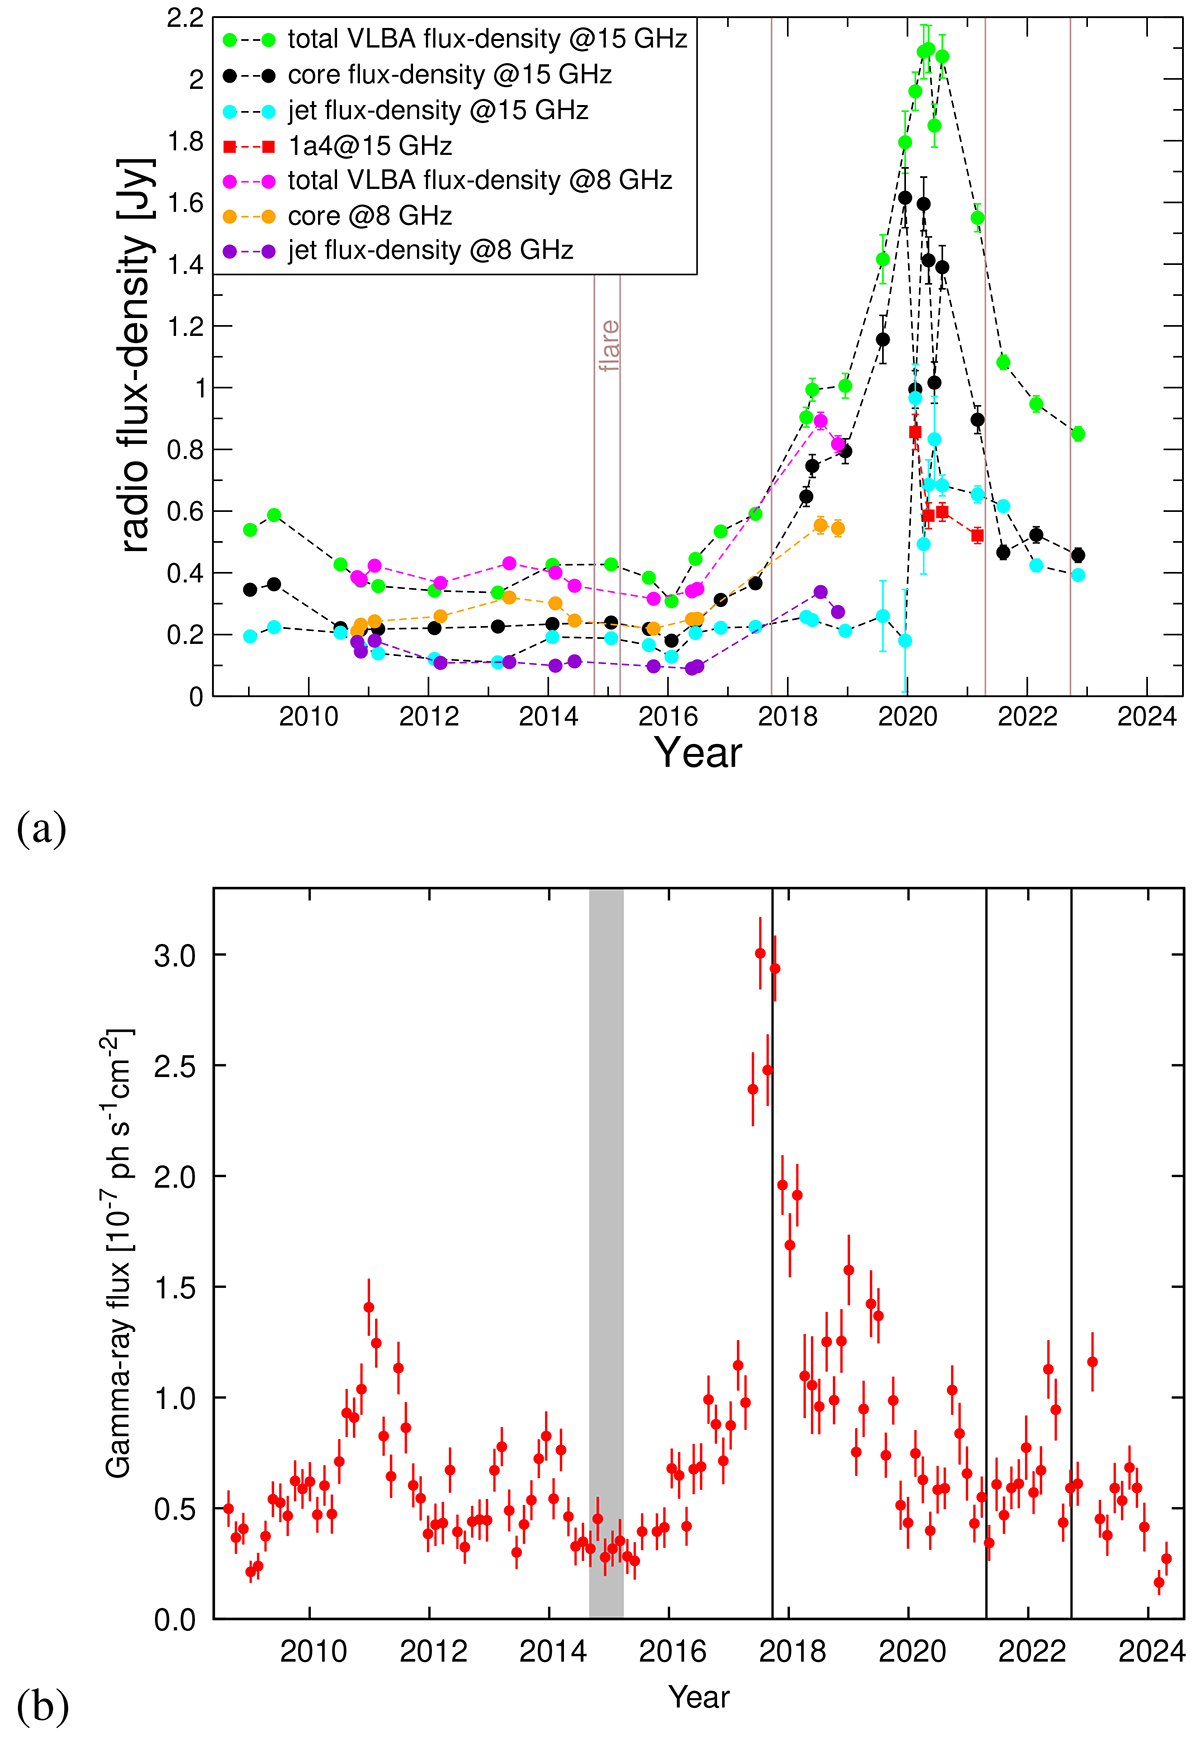
Fig. 7.
Download original image
Radio and Fermi-LAT γ-ray fluxes. (a) Total radio flux density (light green), the core flux density (black), and the jet flux density (light blue). The red symbols denote the flux of component 1a4. Vertical solid brown lines indicate the dates of the neutrino detections. (b) Fermi-LAT γ-ray fluxes (red points). Epochs of neutrino detections are marked by the three vertical black lines. The time of increased neutrino flux is highlighted by the gray-shaded area. The tabulated data are available online in Tables C.1 and C.2.
Current usage metrics show cumulative count of Article Views (full-text article views including HTML views, PDF and ePub downloads, according to the available data) and Abstracts Views on Vision4Press platform.
Data correspond to usage on the plateform after 2015. The current usage metrics is available 48-96 hours after online publication and is updated daily on week days.
Initial download of the metrics may take a while.