Fig. 3
Download original image
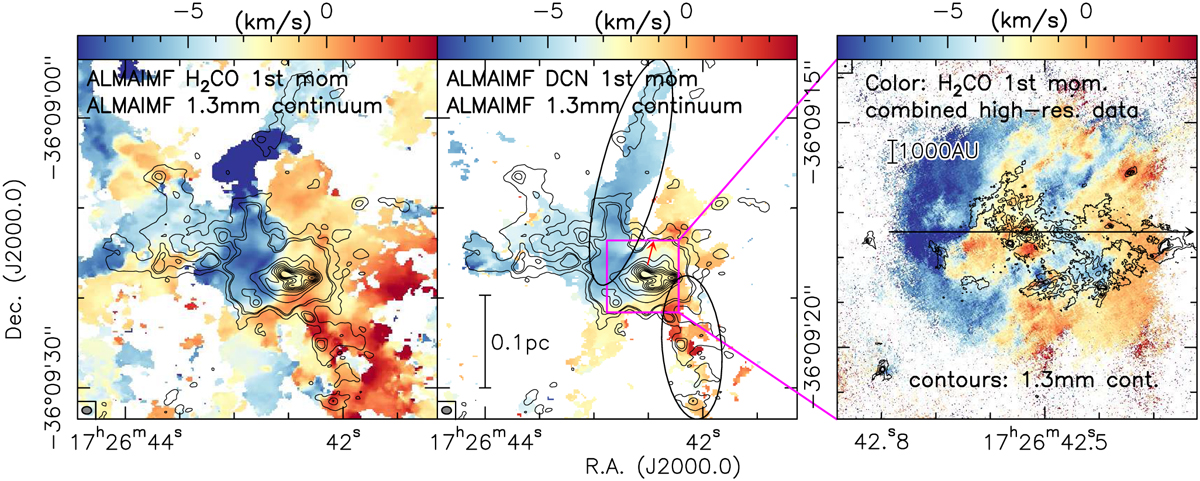
Zoom-in plots from the more central region in G351. The two left panels show the ALMA-IMF data (Motte et al. 2022; Ginsburg et al. 2022; Cunningham et al. 2023) from the first zoom-region (black box in Fig. 1). The color-scale in the left and middle panels are the 1st moment maps in H2CO and DCN. The contours show the 1.3 mm continuum emission starting at 4σ and continue in 8σ steps (1σ=0.6mJybeam−1). The ellipses in the middle panel outline the areas used for the mass flow rate estimates, and the red arrow shows the direction of the red-shifted outflow lobe from Beuther et al. (2017). The right panel then shows the final zoom-in (magenta boxes in middle panel and Fig. 1) data from the DIHCA and high-resolution studies (Olguin et al. 2021; Beuther et al. 2019) with the H2CO 1st moment map in color-scale and the 1.3 mm continuum data in contours (5–25σ in 5σ steps with 1σ=60 µJybeam−1). The arrow in the right panel marks the direction of the position–velocity cut in Fig. 4. Linear scale-bars are shown in the middle and right panels, synthesized beams are presented in the bottom- and top-left corners of the respective panels.
Current usage metrics show cumulative count of Article Views (full-text article views including HTML views, PDF and ePub downloads, according to the available data) and Abstracts Views on Vision4Press platform.
Data correspond to usage on the plateform after 2015. The current usage metrics is available 48-96 hours after online publication and is updated daily on week days.
Initial download of the metrics may take a while.