Fig. 3.
Download original image
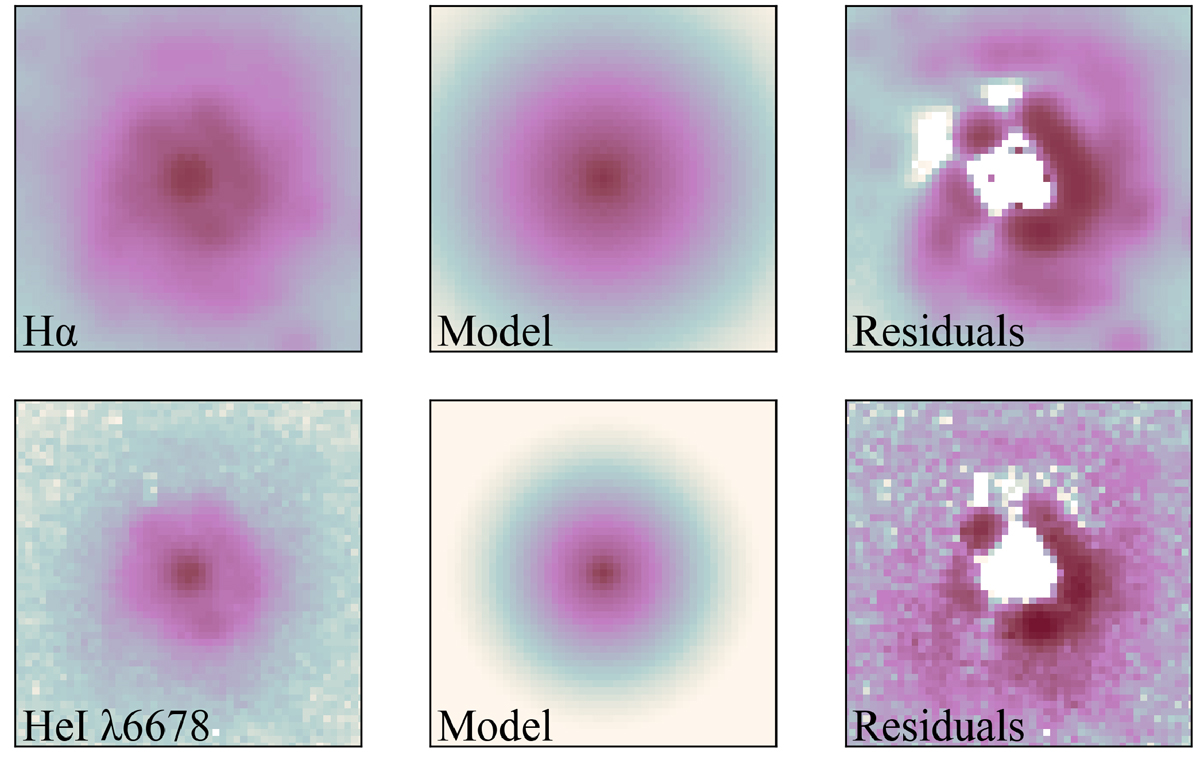
Maps of the observed hydrogen and helium emission lines. Upper panels, from left to right: Map of the observed Hα emission line, fitted model to the AGN profile (see text), and residuals between the observed map and the AGN fitted profile. Lower panels: Same maps, but of the observed HeIλ 6678 Å emission line. Orientation is north up, east to the left. The panel sizes are 10 arcsec × 10 arcsec.
Current usage metrics show cumulative count of Article Views (full-text article views including HTML views, PDF and ePub downloads, according to the available data) and Abstracts Views on Vision4Press platform.
Data correspond to usage on the plateform after 2015. The current usage metrics is available 48-96 hours after online publication and is updated daily on week days.
Initial download of the metrics may take a while.