Open Access
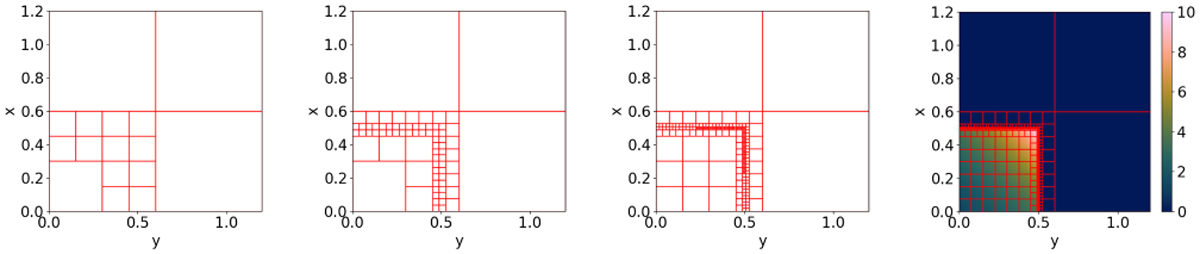
Fig. A.1
Download original image
The progressively finer subdivisions produced by the numerical integration scheme is presented, using as an example one of the test functions from Genz (1984) that are used in the validation procedure described in appendix B. In the last figure, the function used in the integration is also shown in color.
Current usage metrics show cumulative count of Article Views (full-text article views including HTML views, PDF and ePub downloads, according to the available data) and Abstracts Views on Vision4Press platform.
Data correspond to usage on the plateform after 2015. The current usage metrics is available 48-96 hours after online publication and is updated daily on week days.
Initial download of the metrics may take a while.