Fig. 1
Download original image
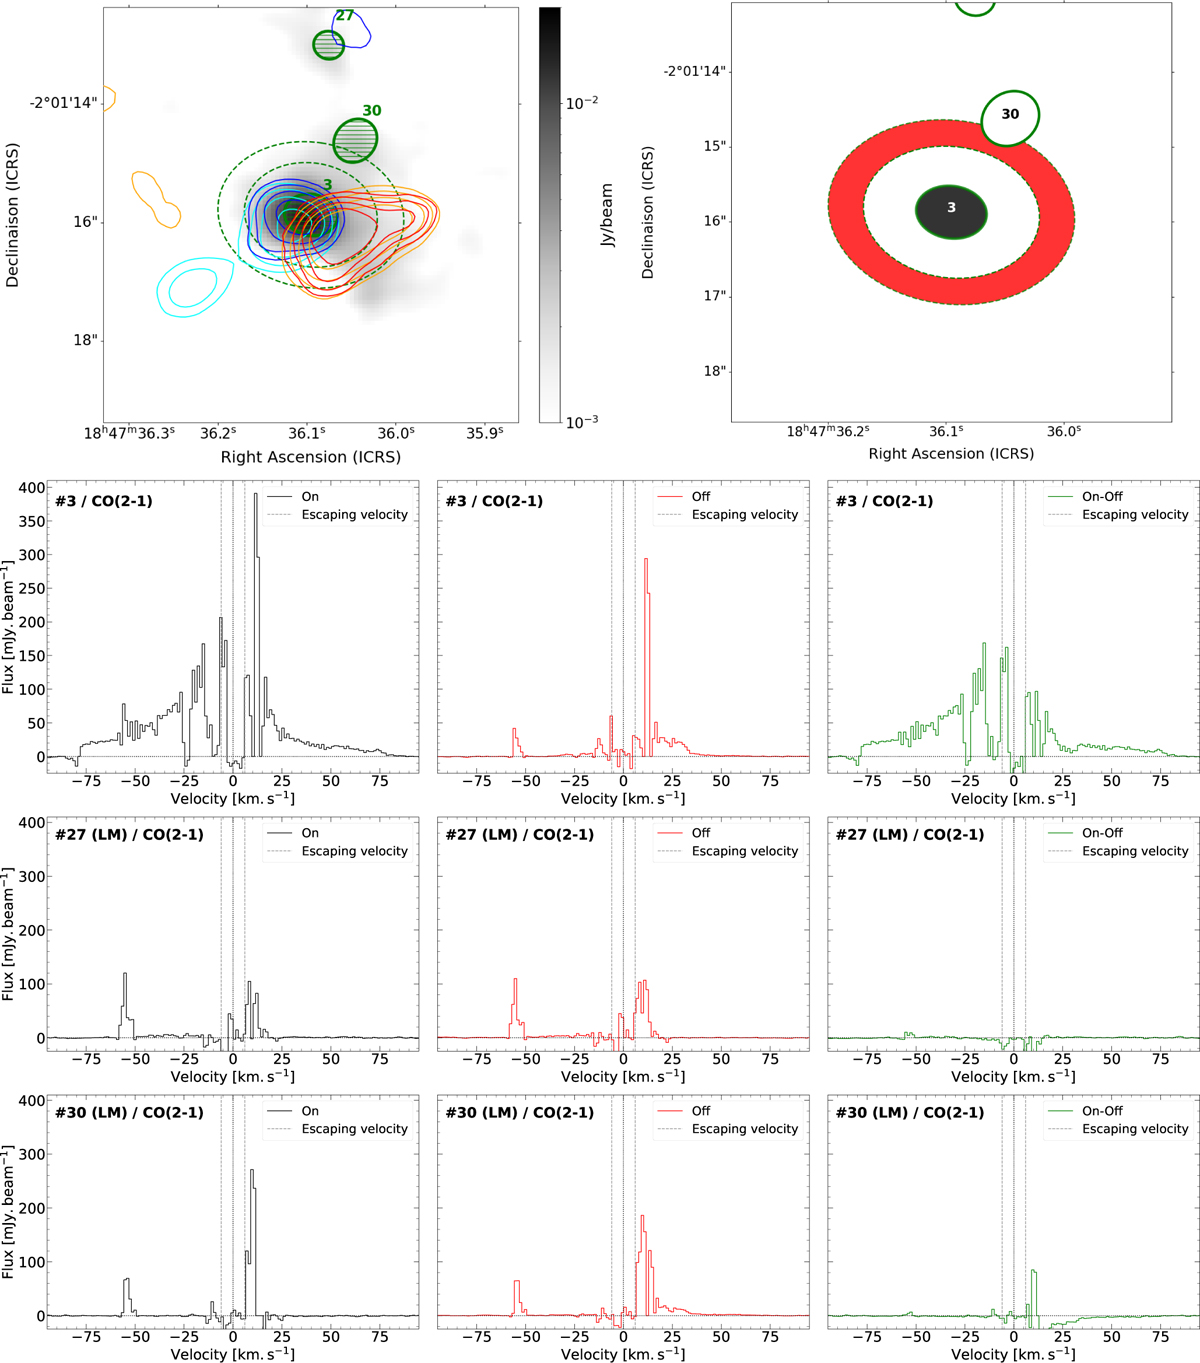
Overview of the outflow detection procedure using the On–Off spectra presented in Sect. 3.1. Top Left: Zoomed-in image of the continuum core #3 overlaid on the 1.3 mm dust continuum map of W43-MM2 (in grayscale). The green ellipses correspond to the FWHM of the extracted source sizes to the continuum emission by the getsf algorithm. Colored CO (2–1) contours are 10, 20, 40 and 80 in units of σ, with σ = 14.3, 12.6, 10.8, 9.0 mJy beam−1 km s−1 for cyan, blue, orange and red contours respectively. The corresponding velocity ranges are ±15–23 km s−1 for cyan and orange, −31–42 km s−1 for blue and +31–50 km s−1 for red. These velocities have been centered on the VLSR of the core (see text). Top Right: Example of the On (black ellipse) and Off (red annulus) spectra computation used to estimate the core-averaged background-subtracted spectra, here for core #3. Bottom: Resulting CO(2–1) On (black), Off (red), and On–Off (green) spectra for cores #3, #27 and #30. Core #3 shows clear line wings, representative of its bipolar outflow that can be analyzed in its On–Off spectra. The black and red spectra are computed in the black ellipse and red annulus of the top right panel. The gray dashed lines correspond to the escaping velocity (i.e., the velocity needed to escape the gravitational orbit) presented in Sect. 3.4. The spectra of cores #27 and #30 are extracted with the same method. These core do not show any sign of outflow, as expected for core #30 when looking at the map in the top panel, while the On–Off spectrum of core #27 does not present a blue line wing.
Current usage metrics show cumulative count of Article Views (full-text article views including HTML views, PDF and ePub downloads, according to the available data) and Abstracts Views on Vision4Press platform.
Data correspond to usage on the plateform after 2015. The current usage metrics is available 48-96 hours after online publication and is updated daily on week days.
Initial download of the metrics may take a while.