Fig. 3.
Download original image
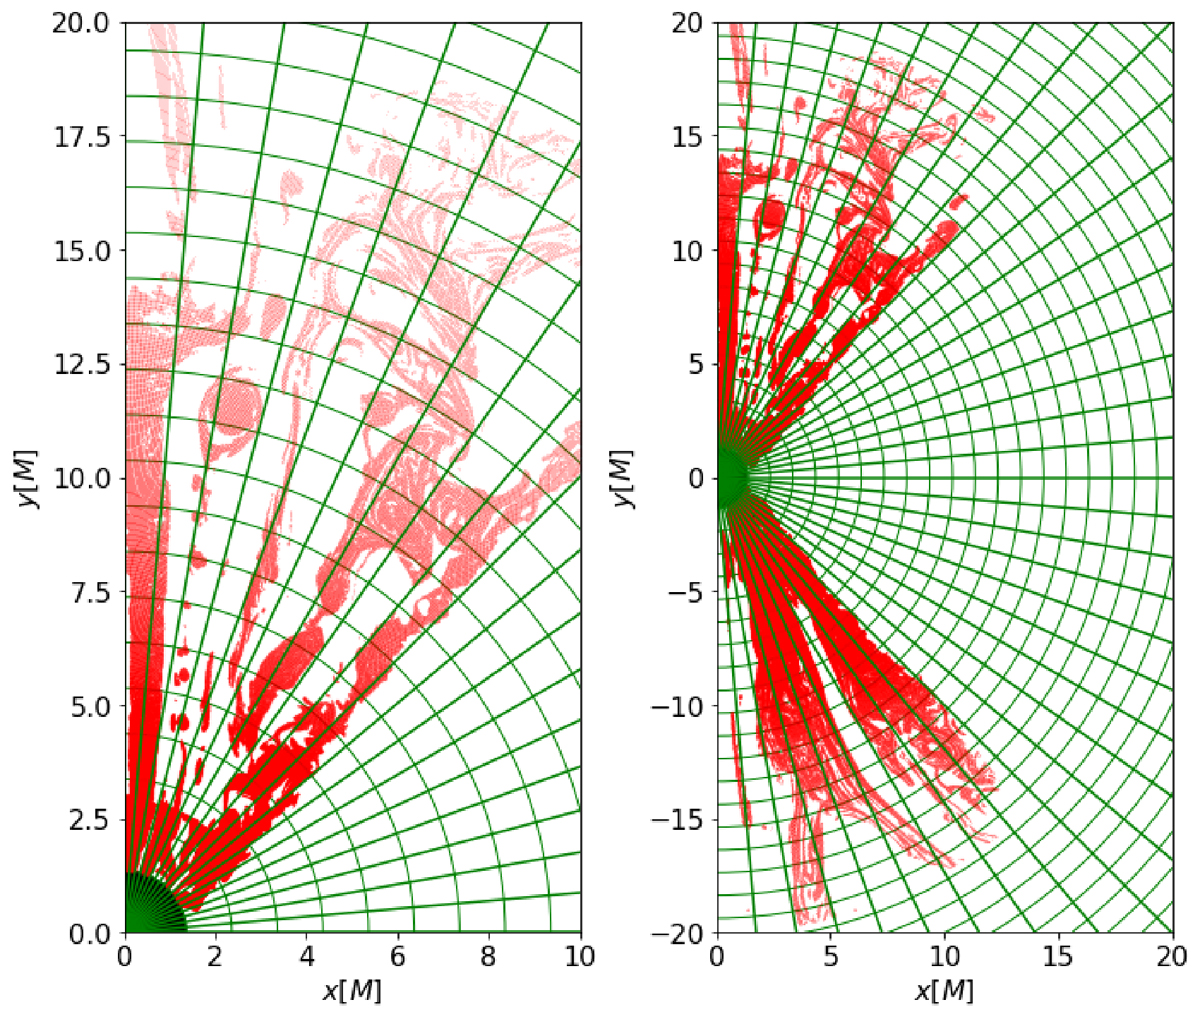
Determination of plasma (red) in the reconnection region and places of high magnetic turbulence. They are selected after applying limits on the toroidal current, magnetization, plasma β, density, and dimensionless temperature. The green grid corresponds to the discretization for the purpose of parameter averaging. The snapshot is the same as that shown in Fig. 2.
Current usage metrics show cumulative count of Article Views (full-text article views including HTML views, PDF and ePub downloads, according to the available data) and Abstracts Views on Vision4Press platform.
Data correspond to usage on the plateform after 2015. The current usage metrics is available 48-96 hours after online publication and is updated daily on week days.
Initial download of the metrics may take a while.