Fig. 5.
Download original image
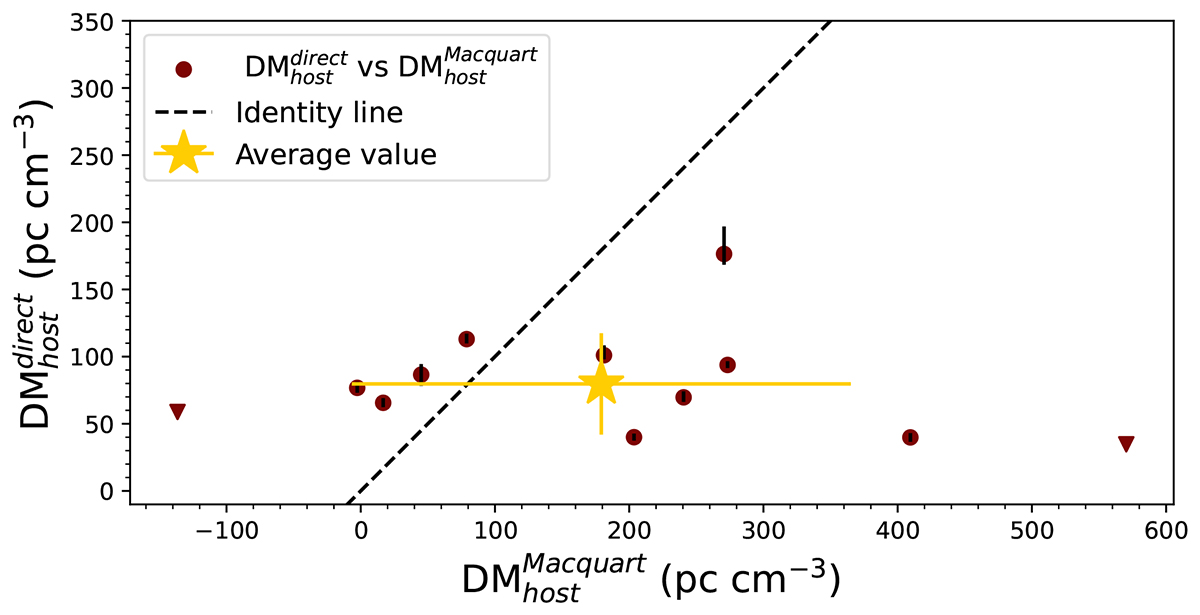
Relation between DM![]() and DM
and DM![]() (dark points), with error bars showing the statistical uncertainties on DM
(dark points), with error bars showing the statistical uncertainties on DM![]() (we did not estimate the uncertainties of our DM
(we did not estimate the uncertainties of our DM![]() values). The dashed line corresponds to the identity line (i.e., the 1:1 relation). The golden star corresponds to the average values of DM
values). The dashed line corresponds to the identity line (i.e., the 1:1 relation). The golden star corresponds to the average values of DM![]() and DM
and DM![]() , with the error bars being their corresponding standard deviation.
, with the error bars being their corresponding standard deviation.
Current usage metrics show cumulative count of Article Views (full-text article views including HTML views, PDF and ePub downloads, according to the available data) and Abstracts Views on Vision4Press platform.
Data correspond to usage on the plateform after 2015. The current usage metrics is available 48-96 hours after online publication and is updated daily on week days.
Initial download of the metrics may take a while.