Fig. 7.
Download original image
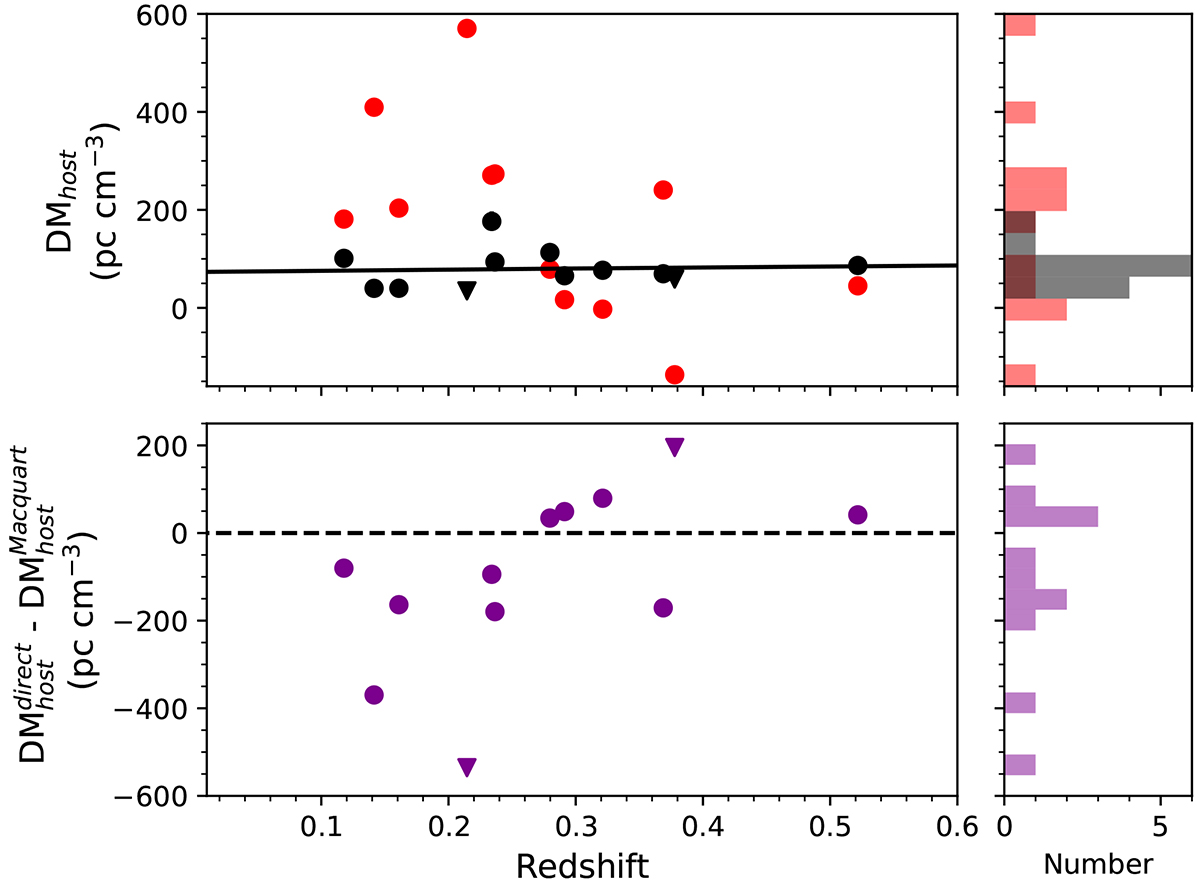
Dependency on Redshift. Top panel: DMhost as a function of redshift. Black and red points correspond to DM![]() and DM
and DM![]() , respectively. The black line is the tendency of DM
, respectively. The black line is the tendency of DM![]() . Negative values for DM
. Negative values for DM![]() are nonphysical; we nevertheless report them for statistical consistency. A histogram of the different samples is shown to the right following the same color scheme. Bottom panel: Difference between DM
are nonphysical; we nevertheless report them for statistical consistency. A histogram of the different samples is shown to the right following the same color scheme. Bottom panel: Difference between DM![]() and DM
and DM![]() as a function of redshift (purple dots). The dashed black line at value 0 indicates where DM
as a function of redshift (purple dots). The dashed black line at value 0 indicates where DM![]() and DM
and DM![]() are equal. A histogram of the sample is shown in the right panel.
are equal. A histogram of the sample is shown in the right panel.
Current usage metrics show cumulative count of Article Views (full-text article views including HTML views, PDF and ePub downloads, according to the available data) and Abstracts Views on Vision4Press platform.
Data correspond to usage on the plateform after 2015. The current usage metrics is available 48-96 hours after online publication and is updated daily on week days.
Initial download of the metrics may take a while.