Fig. 1.

Download original image
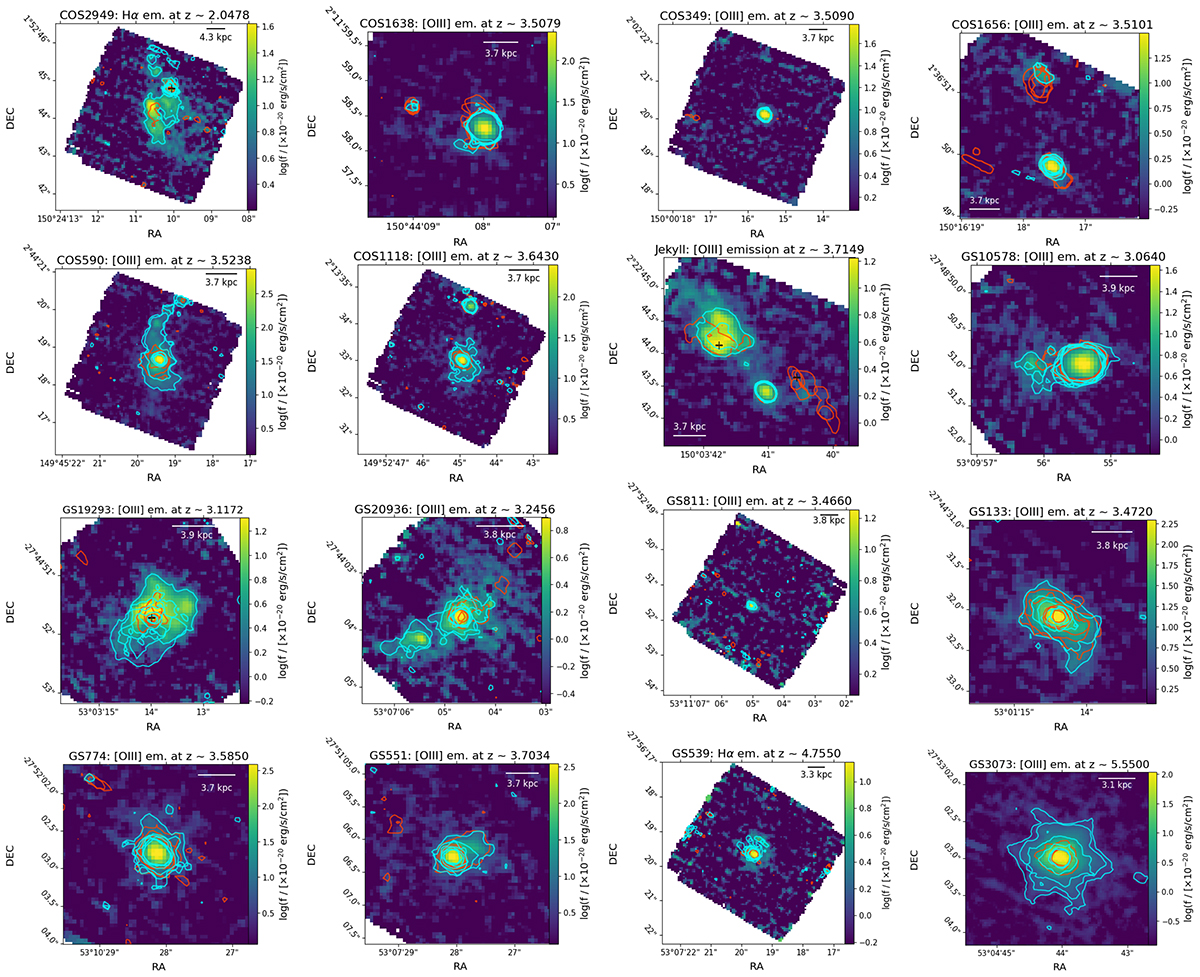
[O III] and Hα maps of the close environments of GA-NIFS AGN systems. They trace the emitting gas observed with NIRSpec IFS in the velocity channels v ∈ [ − 100, 100] km s−1 with respect to the AGN systemic redshift. Contours represent regions where the line emission reaches a significance level of 5σ. Each contour corresponds to emission from a specific velocity bin of 200 km s−1, spanning the full velocity range from −1100 to +1100 km s−1. Cyan contours indicate blueshifted gas, while orange contours mark redshifted gas. Cross symbols identify the AGN position in more complex (interacting) systems. All but GS3073 maps were obtained from NIRSpec cubes with 0.05″/pixel; for GS3073 we opted for the use of the finest 0.03″/pixel sampling to show the disturbed morphology due to very nearby companions (see also Fig. A.1 in Ji et al. 2024). All images are oriented north up, with east to the left.
Current usage metrics show cumulative count of Article Views (full-text article views including HTML views, PDF and ePub downloads, according to the available data) and Abstracts Views on Vision4Press platform.
Data correspond to usage on the plateform after 2015. The current usage metrics is available 48-96 hours after online publication and is updated daily on week days.
Initial download of the metrics may take a while.


