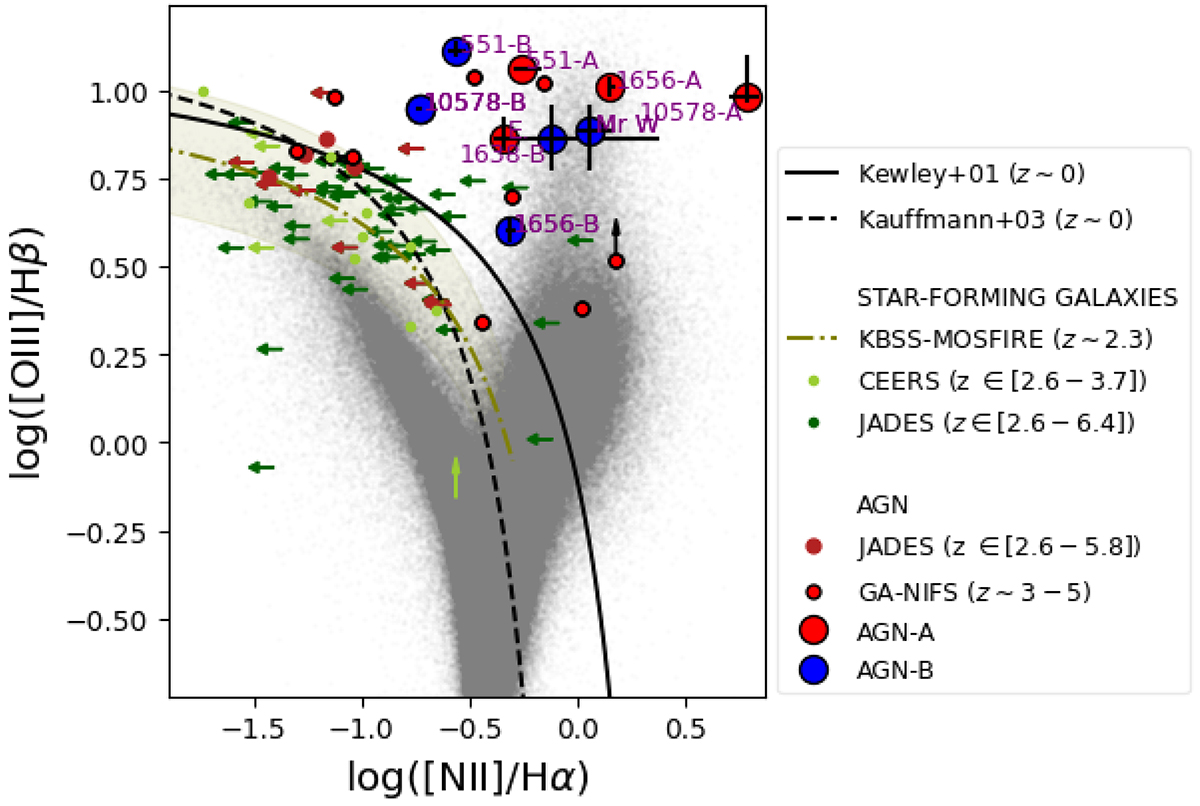
Fig. 8.
Download original image
BPT diagram. Large red and blue circles refer to primary (AGN-A) and secondary (AGN-B) nuclei, respectively. All primary and secondary AGNs are above the solid (Kewley et al. 2001) and dashed (Kauffmann et al. 2003) curves, used to separate purely SFGs (below the curves) from galaxies containing AGNs (above the curves, i.e. the Seyfert region of the BPT). The olive curve indicates the locus of z ∼ 2.3 SFGs from (with intrinsic scatter relative to the median curve in light-olive Strom et al. 2017); additional measurements for z > 2.6 SFGs and AGNs are reported with small symbols (see legend and Sect. 6.1 for details). All reported measurements show that the Seyfert area of the BPT is free from contamination by SFGs at any considered redshift, and, therefore, ensure the AGN classification of the newly discovered sources COS1638-B, GS551-B, Eastfield, Mr. West, COS1656-B, and GS10578-B. All AGN-A and B flux ratios are reported in Table A.2.
Current usage metrics show cumulative count of Article Views (full-text article views including HTML views, PDF and ePub downloads, according to the available data) and Abstracts Views on Vision4Press platform.
Data correspond to usage on the plateform after 2015. The current usage metrics is available 48-96 hours after online publication and is updated daily on week days.
Initial download of the metrics may take a while.