Fig. 2
Download original image
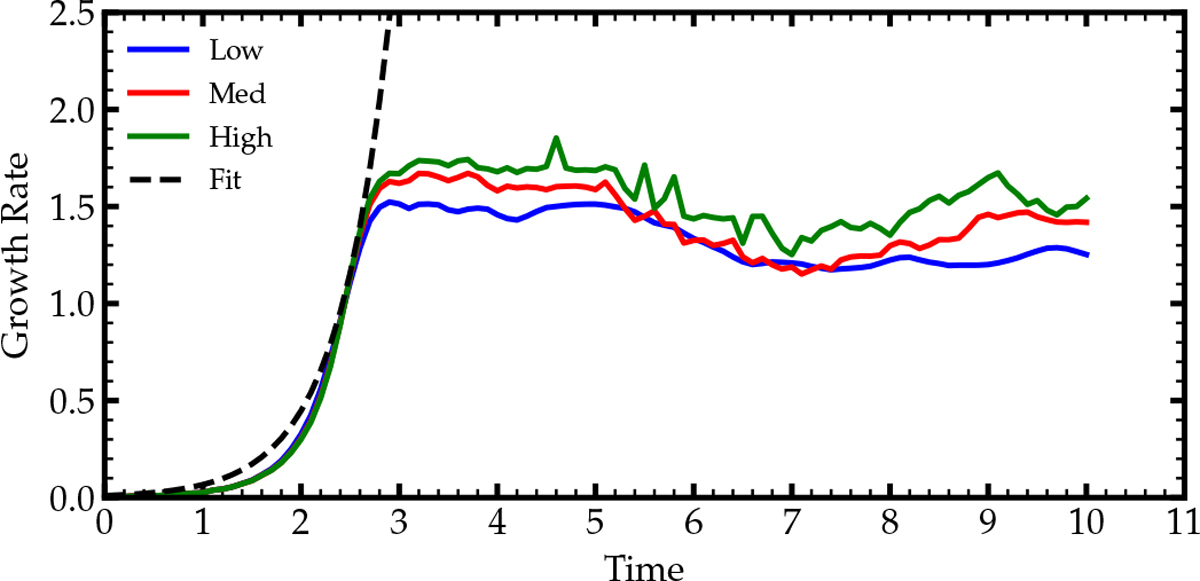
Instability growth rate for the 2D Kelvin-Helmholtz instability test shown in Fig. 1. This growth rate is estimated from the evolution of the quantity ∂ ln ![]() and for three different grid choices, corresponding to “Low” (blue), “Med” (red), and “High” (green) resolution (i.e., [nx, nz] = [512, 256], [1024, 512], and [2048, 1024]). The dashed line corresponds to the best-fitting exponential to the growth rate in the linear regime, which breaks down at t ~ 2.6.
and for three different grid choices, corresponding to “Low” (blue), “Med” (red), and “High” (green) resolution (i.e., [nx, nz] = [512, 256], [1024, 512], and [2048, 1024]). The dashed line corresponds to the best-fitting exponential to the growth rate in the linear regime, which breaks down at t ~ 2.6.
Current usage metrics show cumulative count of Article Views (full-text article views including HTML views, PDF and ePub downloads, according to the available data) and Abstracts Views on Vision4Press platform.
Data correspond to usage on the plateform after 2015. The current usage metrics is available 48-96 hours after online publication and is updated daily on week days.
Initial download of the metrics may take a while.