Fig. 10.
Download original image
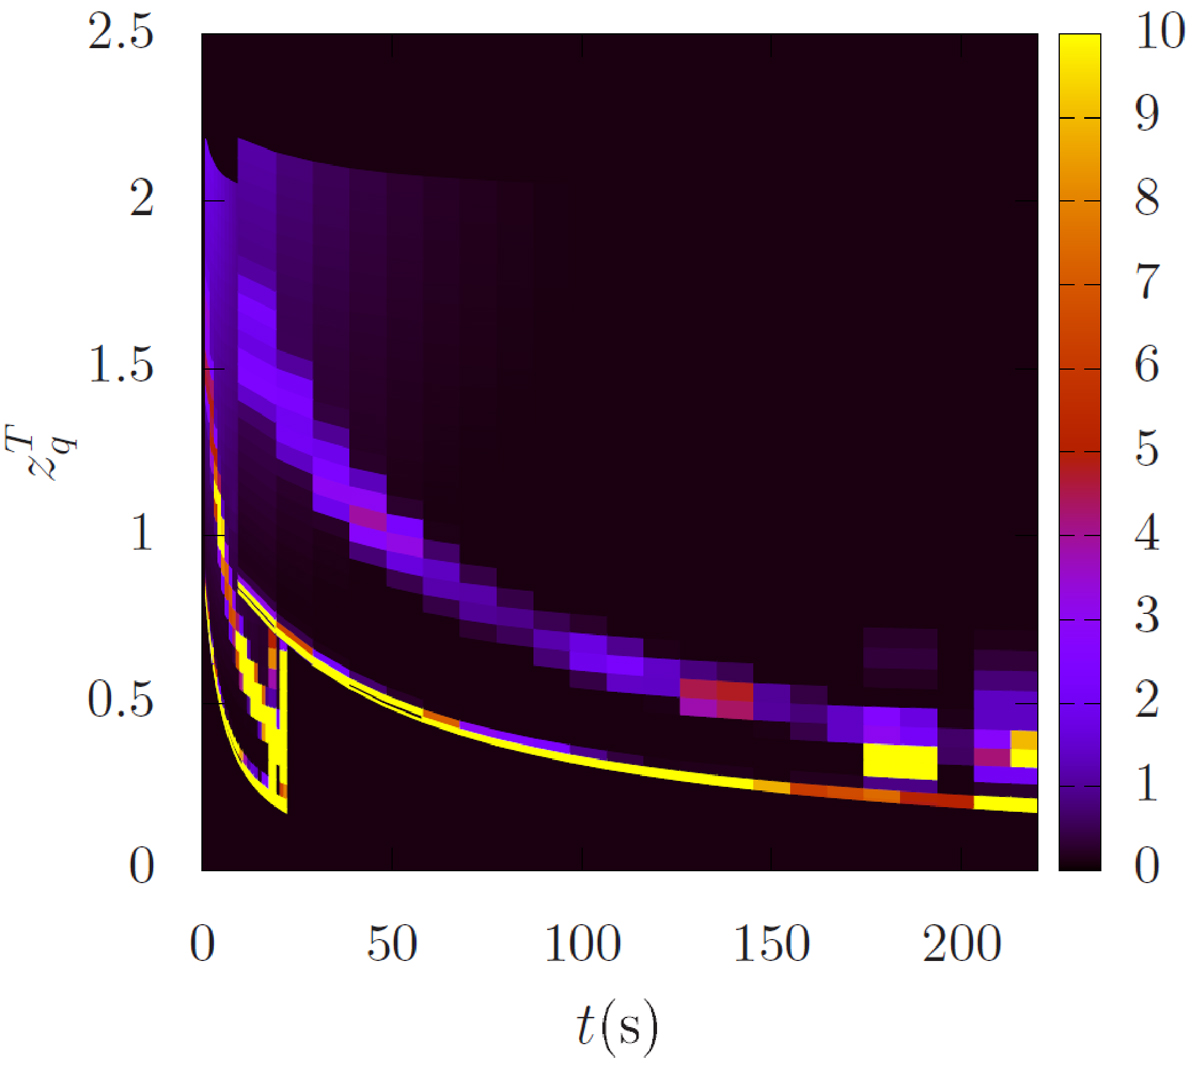
Color-coded synthetic dynamic spectra of T-waves computed as in Fig. 9, but for τ = 1000 and as a function of the normalized wave frequency and delay time. The color scale represents the normalized wave intensity ![]() . The first set of spectra (corresponding to that in Fig. 9) is generated by a beam moving along the radial direction with vb = 8vte in the interval t ≤ 20 s, as two narrow bands at (local) ωpe and 2ωpe. The second spectra is generated by the source ahead of a magnetic “blob” moving along radial direction with vS/10 = 0.8vte (with the beam propagating along magnetic field lines transverse to the radial direction). It extends from t ≃ 0 to t ≃ 250 s, and consists of a broadband curve at (local) 2ωpe, accompanied by a thinner band which follows the same profile but at ωpe. These two types of synthetic spectra are clearly similar to type III and type II emissions, respectively.
. The first set of spectra (corresponding to that in Fig. 9) is generated by a beam moving along the radial direction with vb = 8vte in the interval t ≤ 20 s, as two narrow bands at (local) ωpe and 2ωpe. The second spectra is generated by the source ahead of a magnetic “blob” moving along radial direction with vS/10 = 0.8vte (with the beam propagating along magnetic field lines transverse to the radial direction). It extends from t ≃ 0 to t ≃ 250 s, and consists of a broadband curve at (local) 2ωpe, accompanied by a thinner band which follows the same profile but at ωpe. These two types of synthetic spectra are clearly similar to type III and type II emissions, respectively.
Current usage metrics show cumulative count of Article Views (full-text article views including HTML views, PDF and ePub downloads, according to the available data) and Abstracts Views on Vision4Press platform.
Data correspond to usage on the plateform after 2015. The current usage metrics is available 48-96 hours after online publication and is updated daily on week days.
Initial download of the metrics may take a while.