Fig. 10
Download original image
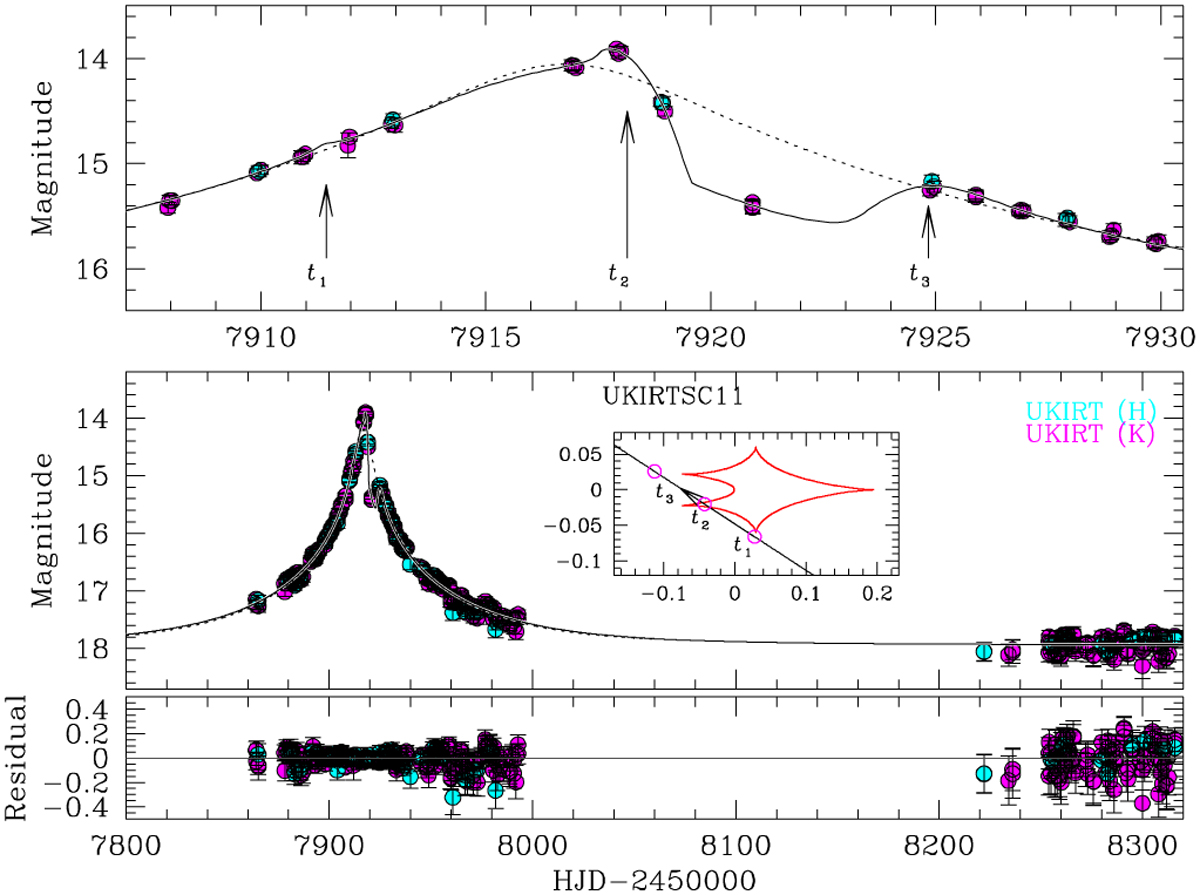
Lensing light curve of UKIRT11. In the inset of the lower panel, the three empty circles on the source trajectory, labeled t1, t2, and t3 , represent the source positions at the times of consecutive approaches to the caustic cusps. The size of each circle is scaled to the size of the source. The times corresponding to these positions are indicated in the light curve by arrows. The dotted curve in the top panel represents a 1L1S model derived by excluding the data points around the anomaly.
Current usage metrics show cumulative count of Article Views (full-text article views including HTML views, PDF and ePub downloads, according to the available data) and Abstracts Views on Vision4Press platform.
Data correspond to usage on the plateform after 2015. The current usage metrics is available 48-96 hours after online publication and is updated daily on week days.
Initial download of the metrics may take a while.