Fig. 2
Download original image
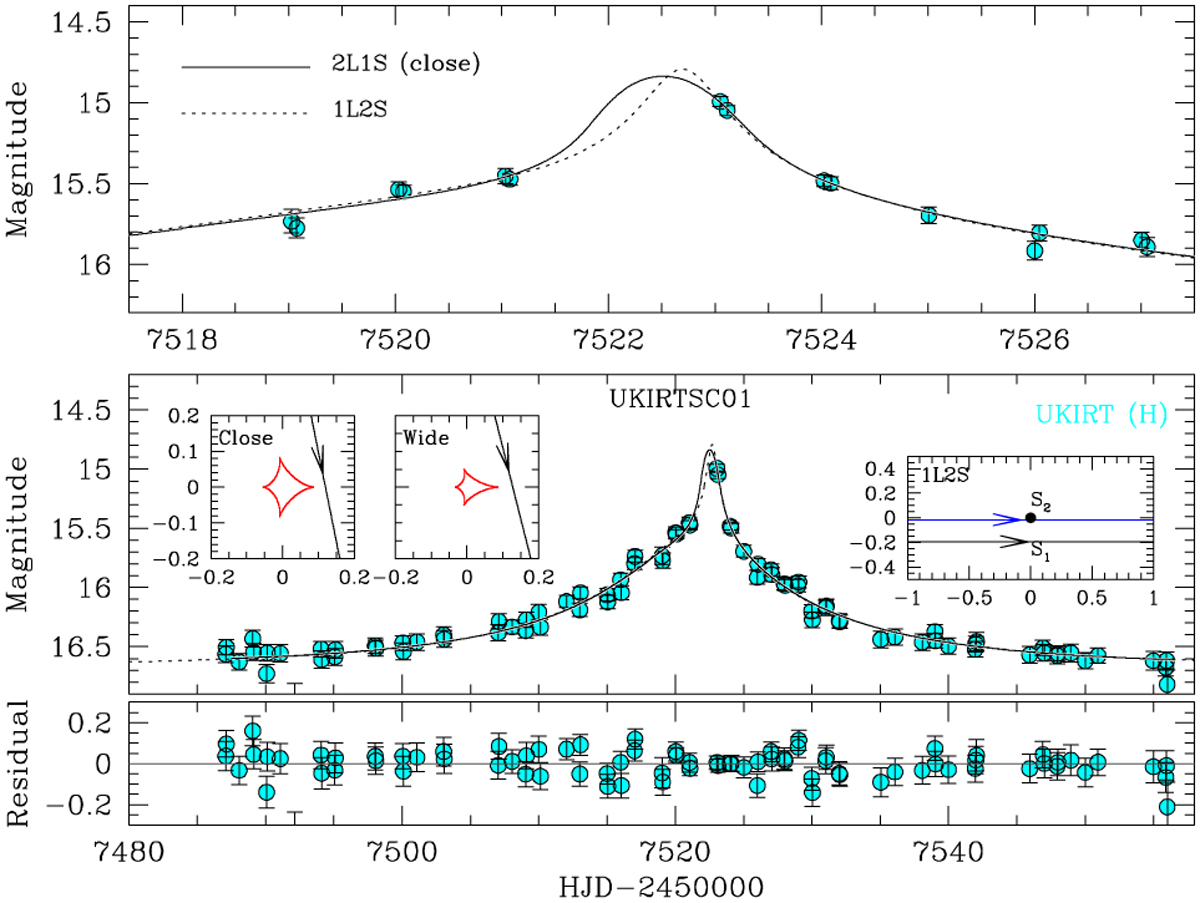
Lensing light curve of UKIRT01. The lower panel displays the full view of the light curve, while the upper panel provides a zoomed-in view of the anomalous region. The insets in the lower panel illustrate the lens system configurations for the 2L1S model (left two insets) and the 1L2S solution (right inset). In the 2L1S configuration, the red closed curve represents the caustic, and the arrowed line indicates the source trajectory. In the 1L2S solution, the lens position is marked by a filled dot at the origin, while the blue and black arrowed lines represent the trajectories of the primary (S1) and secondary (S2) source stars, respectively.
Current usage metrics show cumulative count of Article Views (full-text article views including HTML views, PDF and ePub downloads, according to the available data) and Abstracts Views on Vision4Press platform.
Data correspond to usage on the plateform after 2015. The current usage metrics is available 48-96 hours after online publication and is updated daily on week days.
Initial download of the metrics may take a while.