Fig. 14
Download original image
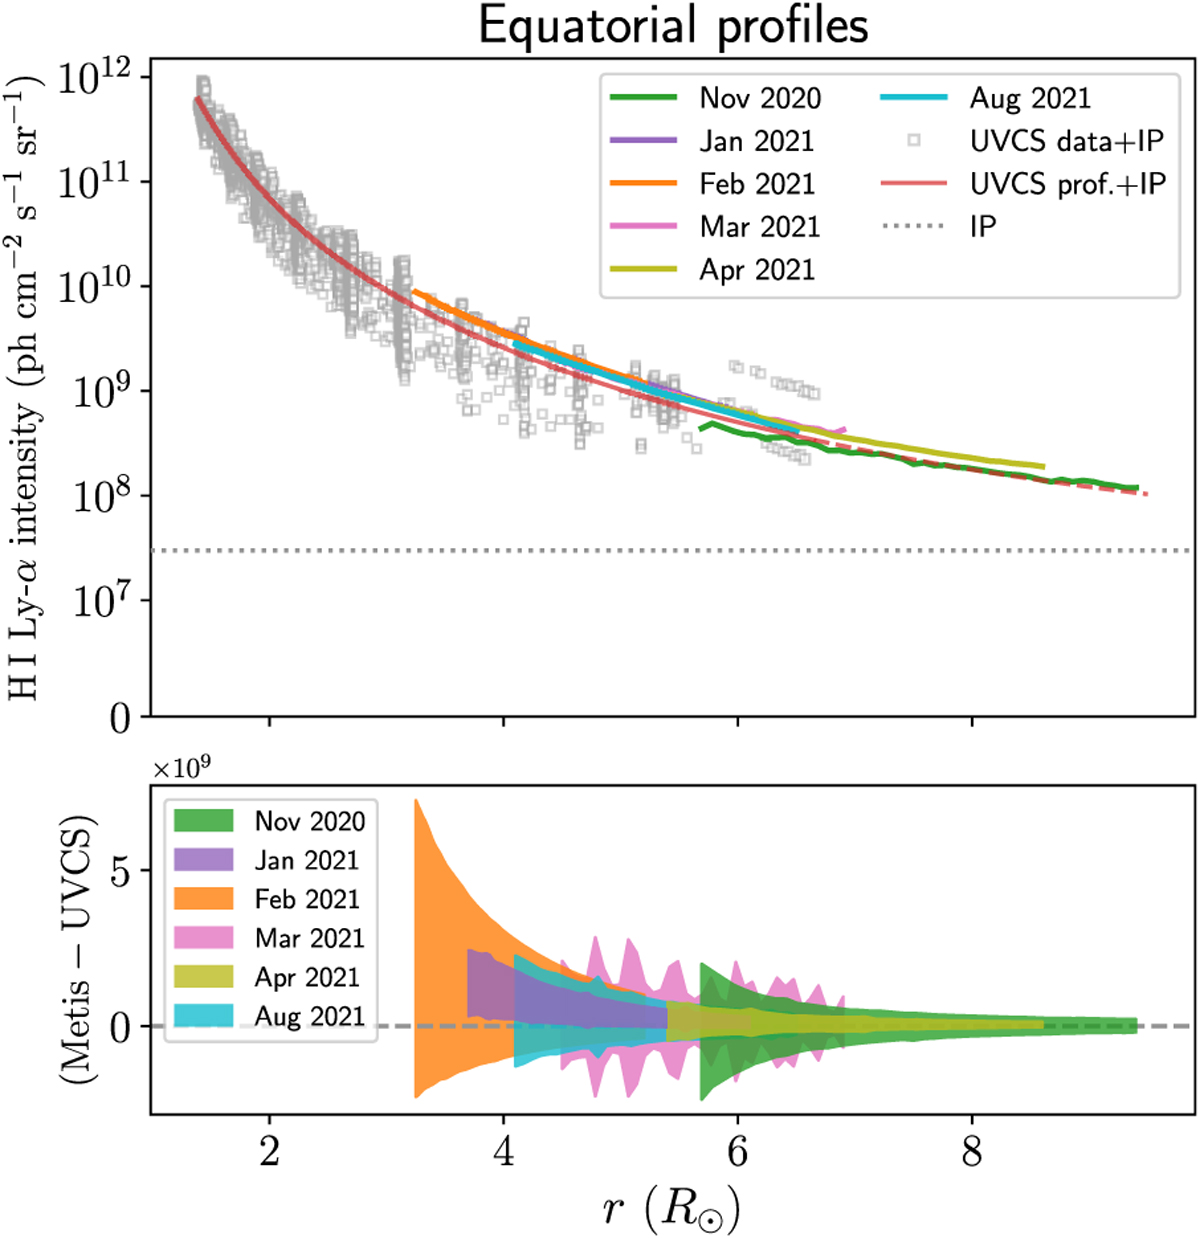
Top panel: equatorial radial profiles of the H I Ly-α line intensity. Average Metis profiles obtained for different months are shown as green (November 2020), purple (January 2021), orange (February 2021), pink (March 2021), olive (April 2021) and cyan (August 2021) lines. UVCS data and intensity profile obtained for equatorial observations and summed with the contribution of the interplanetary H I Ly-α line intensity (IP, dotted line) are depicted as gray squares and red solid line, respectively. The dashed red line shows the extrapolation of the UVCS profile up to 9.5 R⊙ for comparison. Bottom panel: difference between the profiles of Metis and UVCS. The shaded areas represent the width of the distribution of Metis data (see text for details).
Current usage metrics show cumulative count of Article Views (full-text article views including HTML views, PDF and ePub downloads, according to the available data) and Abstracts Views on Vision4Press platform.
Data correspond to usage on the plateform after 2015. The current usage metrics is available 48-96 hours after online publication and is updated daily on week days.
Initial download of the metrics may take a while.